Avalekander Week 14/15
Purpose
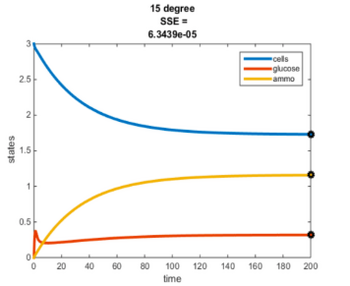
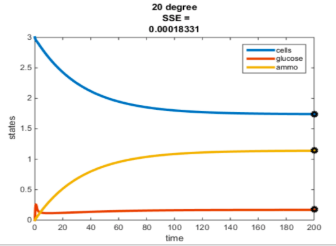
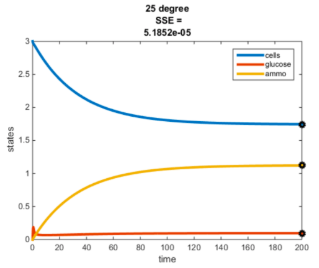
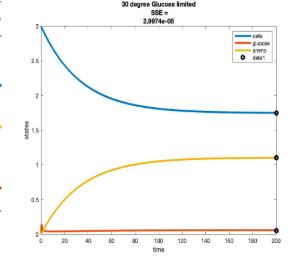
The purpose of this week was using MatLab to simulate models showing temperature dependence of the chemostat reaction demonstrated in the Tai et al. (2007) and (2005) papers. Additionally, the efficiency constant E was altered to reveal how yeast's metabolization of nutrients changes under different conditions and with different levels of nutrient available.
Methods
MatLab files were obtained here from Dr. Fitzpatrick (zipped package).
Temperature Dependence Modeling
Arrhenius equation used:
- r = Ae^(-B/RT)
- r = rate (r)
- A = frequency factor
- B = energy of activation
- R = gas constant (8.3145J/mol K)
- T = temperature (K)
- T1 = T (12C)
- T2 = T (30C)
- Determined B after canceling out the A's and then plugging the values for r, T, and the universal gas constant, R into the Arrhenius equation. Once B was solved for then the value could be plugged back in to solve for A.
- Used the same equation once A And B were solved for with T = 15, 20, 25C to determine r at these temperatures.
- Modeled temperature dependence in MATLAB
Investigating the Efficiency 'Constant'
- The y and E values were taken from the "taiParamsRevised" MATLAB file for all four cases.
- Using both point-slope and slope-intercept formulas, an equation for each temperature E(y) was created relating the points, y and E.
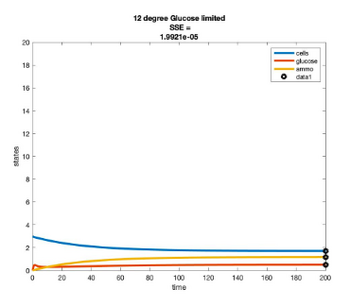
- The "chemostat_2nutrient_dynamics.m" file was modified to process the two developed equations.
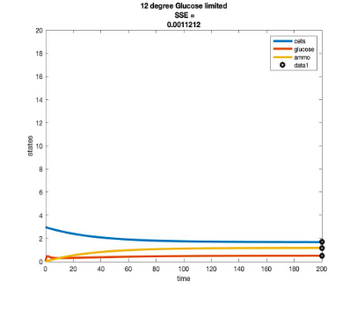
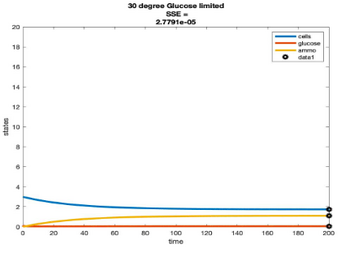
- Results were compared to the previous ones.
Variables found from "taiParamsRevised" file:
12 degree C Glucose-Limited:
- r=0.08
- T=285.15K
- y=0.504504
- E=14.2857
30 degree C Glucose-Limited:
- r=0.46
- T=303.15K
- y=0.054054
- E=14.2857
12 degree C Ammonium-Limited:
- r=0.08
- T=285.15K
- y=16.2162
- E=20.0000
30 degree C Ammonium-Limited:
- r=0.46
- T=303.15K
- y=15.3333
- E=25.0000
Variables calculated using Arrhenius equation:
- A = 4.979 * 10^11
- B = 69,840.58946
- r(15 degrees C) = 0.1087
- r(20 degrees C) = 0.1787
- r(25 degrees C) = 0.289
Equations developed using point-slope and slope-intercept formulas:
- 12 degree C: E = 0.3637y + 14.1022
- 30 degree C: E = 0.7012y + 14.2483
Calculation of r values for part 1
Point slope equations generated for part 2
Results
Temperature Controlled Chemostat
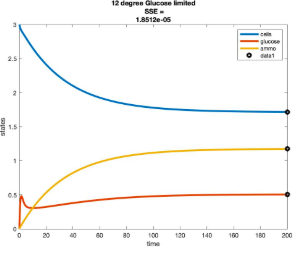
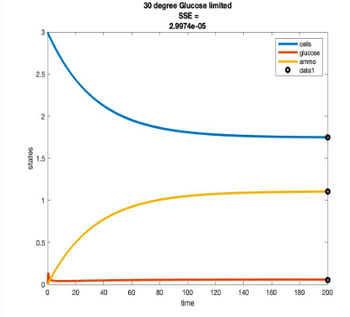
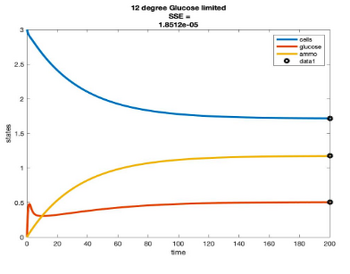
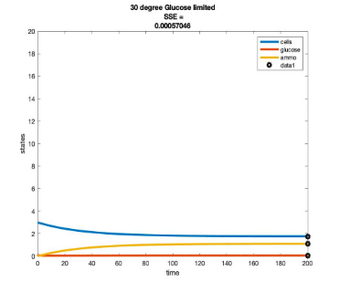
- Plots simulated using glucose as the limiting nutrient
- Residual glucose decreases as the temperature increases
Efficiency Models
Conclusions
- Changing the temperature did not affect the steady states
- For a future experiment maybe including temperatures outside of the 12 and 30 degree range could be done to see if that makes a bigger difference than using the intermediary 15, 20, 25 degrees.
Acknowledgements
I would like to acknowledge my partner, Angela Abarquez with whom I worked on presenting this information with and met with twice (Monday and Wednesday) and texted with often. We also facetimed on Wednesday evening to finish up and practice presenting. In addition, I want to acknowledge Dr. Fitzpatrick for his assistance in office hours on Wednesday. I also texted with Leanne a few times about how her graphs looked and if they were similar to how Angela and my graphs were turning out. "Except for what is noted above, this individual journal entry was completed by me and not copied from another source." Avalekander (talk) 19:56, 8 May 2019 (PDT)
References
Dahlquist, K., & Fitzpatrick, B. (n.d.). BIOL388/S19: Week 14/15. Retrieved from https://openwetware.org.wiki/BIOL388/S19:Week_14/15
Tai, S. L., Daran-Lapujade, P., Walsh, M. C., Pronk, J. T., & Daran, J. M. (2007). Acclimation of Saccharomyces cerevisiae to low temperature: a chemostat-based transcriptome analysis. Molecular Biology of the Cell, 18(12), 5100-5112. DOI: 10.1091/mbc.e07-02-0131
Tai, S. L., Boer, V. M., Daran-Lapujade, P., Walsh, M. C., de Winde, J. H., Daran, J. M., and Pronk, J. T. (2005). Two-dimensional transcriptome analysis in chemostat cultures: combinatorial effects of oxygen availability and macro- nutrient limitation in Saccharomyces cerevisiae. J. Biol. Chem. 280, 437–447.
Biology 388 Assignments
- Template: Ava Lekander
- User Page: Ava Lekander
- Journal Entries:
- Assignment Pages:
- Class Journal Pages:
- Biology 388 Home Page: BIOL 388 Class Page
