Sahil Patel Week 12
Purpose
The purpose of this assignment is to interpret the figures and data tables in the Tai et al. paper as well as creating simulations in MATLAB.
Methods
Developing a Yeast-in-the-Chemostat Model
- Convert residual glucose and residual ammonia from mM to grams.
- Answer protocol questions
Develop a simulation model for a 2-nutrient chemostat.
- Modify the MATLAB files chemostat_script.m and chemostat_dynamics.m to simulate a 2-nutrient chemostat
- Use what parameters you have determined from the data to simulate the system.
- Answer protocol questions
Results
Protocol Questions
- The yield quantity Y Glu/X: this is a ratio of what quantities? Be specific and relate to the 2-nutrient chemostat model from class.
- Y(Glu/X) = ratio of Biomass produced/ Glucose consumed
- The flux qGlu is a ratio of what quantities? Be specific and relate to the 2-nutrient chemostat model from class.
- flux qGlu = ratio of specific growth rate/ yield quantity
- Convert residual glucose and residual ammonia from mM to grams.
- residual glucose = 0.180156 g of glucose
- residual ammonia = 0.017031 g of ammonia
- Determine the length of time the chemostat is operated before data is collected.
- 1/0.03 = 33.3333 * 3 = 100 ---> around 100 hours to reach steady state.
- Determine as many model parameters as you can from these data: use the "warm" data and both glucose- and ammonium-limited data.
- r = maximum rate of growth
- q = dilution rate
- K = substrate concentration (glucose) at r/2
- L = substrate concentration (ammonium) at r/2
- E = Efficiency (glucose)
- F = Efficiency (ammonium)
- u = feed concentration (glucose)
- v = feed concentration (ammonium)
MATLAB
Graphs Made in MATLAB
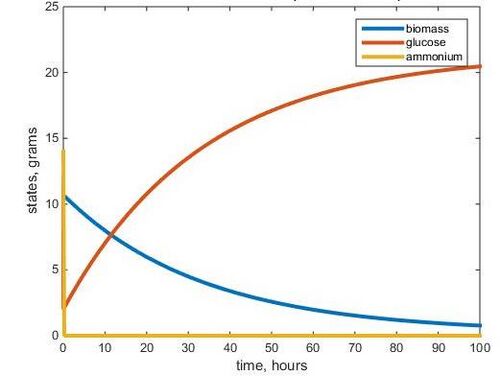
- Figure 1. Graph made in MATLAB modeling warm glucose 2-Nutrient chemostat simulation using F= 1/0.05 and parameters listed above.
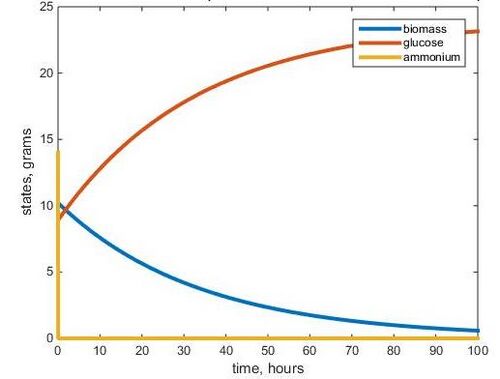
- Figure 2. Graph made in MATLAB modeling warm glucose 2-Nutrient chemostat simulation using F= 64.64 and parameters listed above.
Conclusion
Using parameters from the data in the Tai et al. (2007) paper, we were able to use MATLAB to model a 2-nutrient chemostat experiment. The two nutrients used were glucose and ammonium. By comparing the glucose limited and ammonium limited chemostat environments, we can see how limiting one nutrient affects the overall growth of the population of yeast. The models allowed us to compare steady states of each nutrient and biomass and graphs were created for the 30 degrees Celsius data.
Acknowledgments
I would like to thank my homework partner Desiree Gonzalez. We met up before class on Tuesday, April 23 to work on the assignment together and so we could use each other as a resource for any questions we may have.
- Except for what is noted above, this individual journal entry was completed by me and not copied from another source.
References
- Dahlquist, K. & Fitzpatrick, B.G. (2019, April 16). BIOL388/S19:Week 12. Retrieved from https://openwetware.org/wiki/BIOL388/S19:Week_12 on 16 April 2019.
- Tai, S. L., Boer, V. M., Daran-Lapujade, P., Walsh, M. C., de Winde, J. H., Daran, J. M., and Pronk, J. T. (2005). Two-dimensional transcriptome analysis in chemostat cultures: combinatorial effects of oxygen availability and macro- nutrient limitation in Saccharomyces cerevisiae. J. Biol. Chem. 280, 437–447.
- Tai, S. L., Daran-Lapujade, P., Walsh, M. C., Pronk, J. T., & Daran, J. M. (2007). Acclimation of Saccharomyces cerevisiae to low temperature: a chemostat-based transcriptome analysis. Molecular Biology of the Cell, 18(12), 5100-5112. DOI: 10.1091/mbc.e07-02-0131
Other Assignments
BIOL368 Assignments
Week 1: Instructions, Class Journal and User Page
Week 2: Instructions, Class Journal and Individual Assignment
Week 3: Instructions, Class Journal and Individual Assignment
Week 4: Instructions, Class Journal and Individual Assignment
Week 5: Instructions, Class Journal and Individual Assignment
Week 6: Instructions, Class Journal and Individual Assignment
Week 8: Instructions, Class Journal and Individual Assignment
Week 9: Instructions, Class Journal and Individual Assignment
Week 10: Instructions, Class Journal and Individual Assignment
Week 11: Instructions, Class Journal and Individual Assignment
Week 13: Instructions, Class Journal and Individual Assignment
Week 14: Instructions, Class Journal and Individual Assignment
BIOL388 Assignments
Week 1: Instructions, Class Journal and User Page
Week 2: Instructions, Class Journal and Individual Assignment
Week 3: Instructions, Class Journal and Individual Assignment
Week 4/5: Instructions, Class Journal and Individual Assignment
Week 6: Instructions, Class Journal and Individual Assignment
Week 7: Instructions, Class Journal and Individual Assignment
Week 9: Instructions, Class Journal and Individual Assignment
Week 10: Instructions, Class Journal and Individual Assignment
Week 11: Instructions, Class Journal and Individual Assignment
Week 12: Instructions, Class Journal and Individual Assignment
Week 14/15: Instructions and Individual Assignment

