EdwardRyanTalatala Week 12
Purpose
The purpose of this week's assignment was to create MatLab code that find the steady states of a 2-nutrient chemostat. This required creating differential equations that would find the steady states of biomass, glucose, and ammonium.
Methods
Developing a Yeast-in-the-Chemostat Model
Use Table 1 of the Tai et al (2007) journal club paper to find the following:
- The yield quantity Y Glu/X
- Determine the flux qGlu as a ratio of specific quantities.
- Convert residual glucose and residual ammonia from mM to grams.
- Determine the length of time the chemostat is operated before data is collected.
- Determine as many model parameters as you can from these data: use the "warm" data and both glucose- and ammonium-limited data.
- Develop a simulation model for a 2-nutrient chemostat using the MATLAB files chemostat_script.m and chemostat_dynamics.m to simulate a 2-nutrient chemostat in the zipfile here.
Results
Tai et al. paper
- Y Glu/X is the ratio of grams of dry weight biomass to grams of glucose consumed.
- biomass = x
- glucose consumed = y
- flux qGlu is dilution rate, which is determined by amount of glucose being added to the system over 1 hour
- dilution rate = q
- Residuals:
- Glucose @12°C:
- Residual glucose: 0.504g
- Residual ammonia: 1.110g
- Glucose @30°C:
- Residual glucose: 0.054g
- Residual ammonia: 1.044g
- Ammonium @12°C:
- Residual glucose: 16.214g
- Residual ammonia: 0.026g
- Ammonium @30°C:
- Residual glucose: 15.331g
- Residual ammonia: 0.003g
- Glucose @12°C:
- (1L)(1hr/0.03L)(3 volume changes) = 100 hours
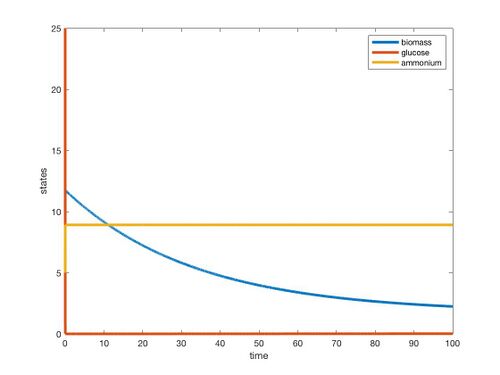
- Parameters for C-Limited at 30°C
- t0 = 0
- t1 = 100
- x0 = 10
- y0 = 25
- z0 = 5
- r = maximum grown rate
- K = 30 (estimation from lecture)
- E = 14.3
- u = 25
- q = 0.03
- F = ammonium efficiency
- L = 2
- v = 5
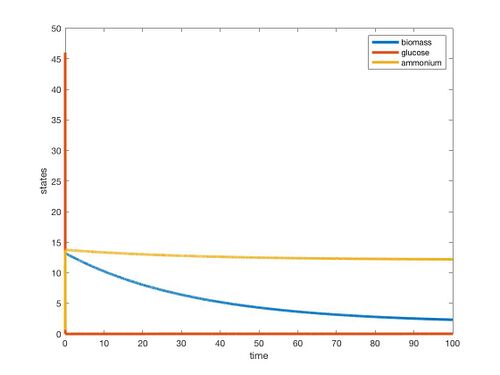
- Parameters for N-Limited at 30°C
- t0 = 0
- t1 = 100
- x0 = 10
- y0 = 46
- z0 = 0.65
- r = maximum grown rate
- K = 30 (estimation from lecture)
- E = 14.3
- u = 25
- q = 0.03
- F = ammonium efficiency
- L = 2
- v = 5
MatLab Results
Attached are the resulting scripts ET 2Nutrient Script
Figure 1. MatLab graph results for C-limited at 30°C
Figure 2. MatLab graph results for N-limited at 30°C
Conclusion
The purpose of this assignment was to break down the Tai et al papers and try to recreate the chemostat model into MatLab 2-nutrient script. We focused on the C-limited and N-limited at 30°C from table 1 of Tai et al 2005. The resulting graphs did show that the nutrients and biomass are reaching steady states; however, it did not result in a clean curve. I would deduce that some of the parameters in the script were incorrect due to user error aka my confusion of what values to apply to each variable. Moreover, the resulting biomass and residual steady state values did not match the values of the table, so I know that the script is incorrect. This assignment will take a lot more meticulous research into the papers, as well as a greater understanding of how MatLab works.
Acknowledgments
I would like to acknowledge my homework partner, Ava with whom I worked with to complete the assignment.
Except for what is noted above, this individual journal entry was completed by me and not copied from another source.
EdwardRyanTalatala (talk) 16:43, 26 April 2019 (PDT)
References
Dahlquist, K. and Fitzpatrick, B. (2019). BIOL388/S19:Week 12. [online] openwetware.org. Available at:Week 12 Assignment Page [Accessed 23 Apr. 2019].
Assignments
- Assignment-Week 1
- Assignment-Week 2
- Assignment-Week 3
- Assignment-Week 4
- Assignment-Week 5
- Assignment-Week 6
- Assignment-Week 7
- Assignment-Week 9
- Assignment-Week 10
- Assignment-Week 11
- Assignment-Week 12
- Assignment-Week 14/15
Journal Entries
- Journal-Week 2
- Journal-Week 3
- Journal-Week 4/5
- Journal-Week 6
- Journal-Week 7
- Journal-Week 9
- Journal-Week 10
- Journal-Week 11
- Journal-Week 12
- Journal-Week 14/15
Class Journal Entries

