Desireegonzalez Week 12
Purpose
- The purpose of this week's assignment is to take a closer look at the figures in the 2007 Tai paper to better understand how to interpret the results given in the tables, while also using this newfound knowledge to create a MATLAB simulation of a 2-nutrient chemostat to answer the questions provided.
Methods
Developing a Yeast-in-the-Chemostat Model
- For this assignment reference material (books and research papers, preferably not random internet sites) on chemostat growth processes was found to be able to answer these questions given below.
- After answering the questions relating to the chemostat reference material, the MATLAB files chemostat_script.m and chemostat_dynamics.m were modified to simulate a 2-nutrient chemostat. You will find those codes in the zipfile here. This task will require the equations that were developed in class.
- The parameters determined from the data were then used to simulate the system and the graphs were saved and uploaded onto Openwetware.
Results
Questions Refering to the 2007 Tai Research Paper
- The yield quantity Y Glu/X: this is a ratio of what quantities? Be specific and relate to the 2-nutrient chemostat model from class.
- The yield quantity Y Glu/X is the biomass yield of glucose; therefore it is the ratio of the biomass dry weight (biomass produced) over the mass of the glucose consumed by the chemostat.
- The flux qGlu is a ratio of what quantities? Be specific and relate to the 2-nutrient chemostat model from class.
- The flux qGlu ratio is the change in glucose levels in the chemostat over time; it is the rate at which glucose is being consumed.
- Convert residual glucose and residual ammonia from mM to grams.
- Determine the length of time the chemostat is operated before data is collected.
- The length of time for which the chemostat is operated before data is collected is 100 hours.
- See photograph in link below.
- Chemostat Length of Time
- Determine as many model parameters as you can from these data: use the "warm" data and both glucose- and ammonium-limited data. The parameters described below would need to be numerical values in order to be able to place them into our MATLAB simulation.
- Glucose and Ammonium Limited Parameters
- R= the maximum rate of the reaction.
- R is not given but can be inferred to be larger than the given q value since it is the maximum dilution rate.
- R/2= half the maximum growth rate of the reaction.
- K= glucose concentration at R/2.
- K=30 (estimated value from lecture due to not knowing how to calculate the actual value)
- L= ammonium concentration at R/2.
- L=15 (estimated value from lecture due to not knowing how to calculate the actual value)
- E= efficiency of glucose.
- E=14.3
- F= efficiency of ammonium.
- F= Will be calcuated using the formula Fxq-qz+qv=0, when rearranged to (z-v)/x; currently the estimated value is 1/0.05 for one trial and is 64.64 for the second trial using the F equation stated above.
- v= ammonium feed concentration in g/L.
- v= 5 (for glucose limited) and 0.65 (for ammonium limited)
- u= glucose feed concentration in g/L.
- u= 25 (for glucose limited) and 46 (for ammonium limited)
- q= dilution rate.
- q= 0.03/hr
- Chemostat Volume= 1L.
- Develop a simulation model for a 2-nutrient chemostat.
- Below are the current MATLAB files that have been created; due to the estimation of the F, L, and K values, the script will have to be updated to accurately portray the 2-Nutrient Chemostat simulation.
Graphs of Post-Simulation Trials for a 2-Nutrient Chemostat
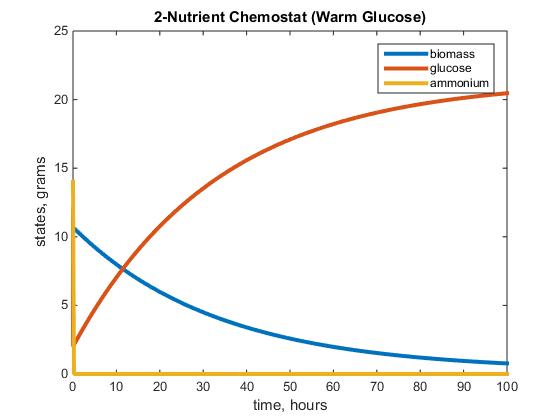
 Figure 1: The graph above depicts the warm glucose 2-Nutrient chemostat simulation after running the model with the parameters listed above, using F= 1/0.05.
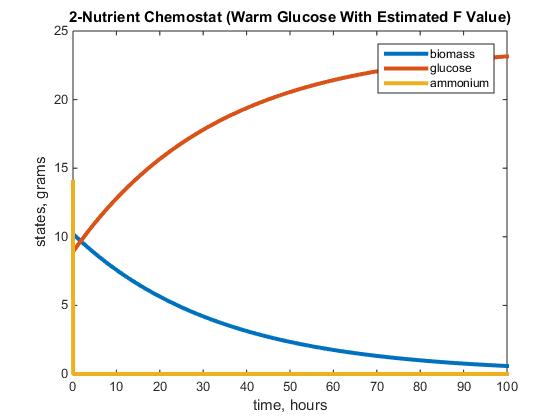
 Figure 2: The graph above depicts the warm glucose 2-Nutrient chemostat simulation after running the model with the parameters listed above, using the estimated value F= 64.64.
Questions Referring to Post-Simulation of a 2-Nutrient Chemostat
- Do the graphs show the system going to steady state?
- The biomass and the ammonium lines of the two graphs appear to be going to steady state around 90 hours.
- However, the glucose lines on both graphs does not appear to be going toward steady state.
- Do the steady states match the Table 1?
- I am not sure how to determine if the graph steady states match the ones in Table 1.
Conclusion
The purpose of this assignment was to learn how to create a MATLAB script for a 2-Nutrient chemostat using data obtained from the two Tai papers which we reviewed in Journal Club during Assignment Week 9. Throughout this process, the addition of an equation with the Z variable made sense in my mind since the addition of a Y equation was due to the simulation of 1-Nutrient. However, the actual calculations of the parameters that would be inserted into the MATLAB scripts for a 2-Nutrient chemostat were more difficult for me to understand. The lectures on the topic were very confusing and I wasn't really sure how to further find and integrate the parameters that we had yet to go over in class. I attempted the homework assignment to my greatest ability and even contacted other students in the class to find that we were all equally lost. Although the current 2-Nutrient simulation can be deemed inconclusive due to the missing values for parameters like z, K, and L, I believe that with further instruction and a better understanding of the concepts will eventually lead to the production of a perfectly working MATLAB script for a 2-Nutrient chemostat.
Acknowledgements
- I communicated in person with my homework partner, Sahil to go over what we believed the answers to the assignment questions were, and also how we believed a 2-nutrient chemostat simulation must be made on MATLAB.
- I also communicated in person with Leanne, Brianna, and Austin to share links that we used as references to answer the questions on this assignment and to compare the calculations we obtained for the experimental time and grams of glucose and ammonium.
- The MATLAB files needed for the completion of this assignment were provided by Dr. Dahlquist and Dr. Fitzpatrick.
Except for what is noted above, this individual journal entry was completed by me and not copied from another source. Desireegonzalez (talk) 20:09, 26 April 2019 (PDT)
References
Dahlquist, K. & Fitzpatrick, B.G. (2019, April 16). BIOL388/S19:Week 12. Retrieved from https://openwetware.org/wiki/BIOL388/S19:Week_12 on 16 April 2019.
MATLAB (Version R2014b) [Computer software]. (n.d.). Retrieved 18 April 2019.
Tai, S. L., Boer, V. M., Daran-Lapujade, P., Walsh, M. C., Winde, J. H., & Daran, J. (2005). Two-dimensional Transcriptome Analysis in Chemostat Cultures Combinational Effects of Oxygen Availability and Macronutrient Limitation in Saccharomyces cerevisiae. Retrieved April 22, 2019, from http://www.jbc.org/content/280/1/437.long
Tai, S. L., Daran-Lapujade, P., Walsh, M. C., Pronk, J. T., & Daran, J. (2007). Acclimation of Saccharomyces cerevisiae to Low Temperature: A Chemostat-based Transcriptome Analysis. Molecular Biology of the Cell, 18(12), 5100-5112. doi:10.1091/mbc.e07-02-0131
Below are the links to all the Assignments and Journal Entries of the Spring 2019 Semester.
User Page: user:desireegonzalez
Template Page: template:desireegonzalez
Weekly Assignment Pages:
Individual Journal Entry Pages:
- desireegonzalez Week 1
- desireegonzalez Week 2
- desireegonzalez Week 3
- desireegonzalez Week 4/5
- desireegonzalez Week 6
- desireegonzalez Week 7
- desireegonzalez Week 9
- desireegonzalez Week 10
- desireegonzalez Week 11
- desireegonzalez Week 12
- desireegonzalez Week 15
Shared Journal Pages: