Mia Huddleston Week 6
Electronic Lab Notebook
Purpose
To create a correlation analysis between genetic diversity and CD4 T cell counts using S and theta values of 4 different subjects. Our prediction is that there will be a positive correlation between genetic diversity and CD4 T cell counts.
Methods and Results
- Anu, Colin, Will and I are each collecting the S and theta values of one subject each since we will all be using this information. Anu is collecting data for subject 6, I am collecting data for subject 8, Will is collecting data for subject 9, and Colin is collecting this data for subject 14.
- I am collecting my data by downloading all of subject 8's data onto my BiologyWorkbench, and running a CLUSTALW of each
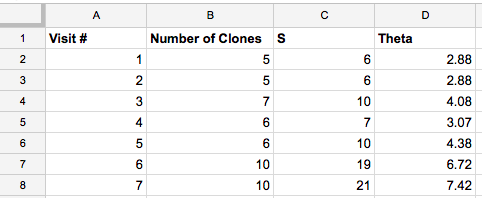
- I can find the number of clones and S for each visit from this
- Then I add this data into a group googledoc that Anu made and shared with the 4 of us
- This resulted in the table bellow
- Anu then inserted all of the CD4 counts with the S and Theta values into an Excel document and created graphs from that data while I made rooted trees for each subject
- The Rooted trees can be seen in the Data and Files section bellow
- The graphs that were created compared S and CD4 counts per subject
- At a glance they did not show any correlation
Data and Files
- Rooted trees of all subjects
- Subject 6 Sequence Data
- Subject 8 Sequence Data
- Subject 9 Sequence Data
- Subject 14 Sequence Data
- Data and graphs comparing genetic diversity and CD4 T cell counts
Conclusion
We found that there was no correlation between genetic diversity and CD4 T cell counts signified by both S values vs CD4 T cell count or Theta values vs CD4 T cell counts. There was a tentative trend between genetic diversity and CD4 counts over time. A more inclusive data set with a greater number of data points per subject, more subjects, and a greater amount of time could show a more positive and accurate result.
Presentation Powerpoint
The PDF version of our presentation can be found here.
Acknowledgements
This work was done with help of Anu Varshneya, Colin Wikholm, and Will Fuchs in class. In addition Anu Varshneya and I met Sunday night to complete and practice our powerpoint. While I worked with the people noted above, this individual journal entry was completed by me and not copied from another source. Mia Huddleston 15:57, 10 October 2016 (EDT)
References
- Donovan S and Weisstein AE (2003) Exploring HIV Evolution: An Opportunity for Research. In Jungck JR, Fass MR, and Stanley ED, eds. Microbes Count! West Chester, Pennsylvania: Keystone Digital Press.
- Markham, R.B., Wang, W.C., Weisstein, A.E., Wang, Z., Munoz, A., Templeton, A., Margolick, J., Vlahov, D., Quinn, T., Farzadegan, H., & Yu, X.F. (1998). Patterns of HIV-1 evolution in individuals with differing rates of CD4 T cell decline. Proc Natl Acad Sci U S A. 95, 12568-12573. doi: 10.1073/pnas.95.21.12568
- Vlahov, D., Anthony, J.C., Munoz, A., Margolick, J., Nelson, K.E., Celentano, D.D., Solomon, L., Polk, B.F. (1991). The ALIVE study, a longitudinal study of HIV-1 infection in intravenous drug users: description of methods and characteristics of participants. NIDA Res Monogr 109, 75-100.
- James, M. M., Wang, L., Musoke, P., Donnell, D., Fogel, J., Towler, W. I., ... & Eshleman, S. H. (2011). Association of HIV diversity and survival in HIV-infected Ugandan infants. PLoS One, 6(4), e18642. DOI: 10.1371/journal.pone.0018642
- Araújo, L. A. L., & Almeida, S. E. (2013). HIV-1 diversity in the envelope glycoproteins: implications for viral entry inhibition. Viruses, 5(2), 595-604. DOI: doi:10.3390/v5020595
- Rachinger, A., Kootstra, N. A., Gijsbers, E. F., van den Kerkhof, T. L., Schuitemaker, H., & Van‘t Wout, A. B. (2012). HIV-1 envelope diversity 1 year after seroconversion predicts subsequent disease progression. AIDS, 26(12), 1517-1522. DOI: 10.1097/QAD.0b013e328354f539
- Week 6 Assignment Page
Useful links
User Page: Mia Huddleston
Bioinfomatics Lab: Fall 2016
Class Page: Bioinfomatics Laboratory, Fall 2016
