Mia Huddleston Week 4
Electronic Lab Notebook
Purpose
The purpose of these activities are to analyze sequence data from 15 individuals with HIV and attempt to determine if the HIV is from a single source. This was done using the biology workbench to determine the differences between each sequence person to person.
Methods and Results
- I first want to upload “visit_1_S1_S9.txt” and “visit_1_S10_S15.txt” files into the nucleic acid tool set on my biology workbench
- I do this by logging into my Workbench, clicking on "nucleic tools," then downloading each file to the workbench
- I then generated a multiple sequence alignment and distance tree for 12 of these sequences
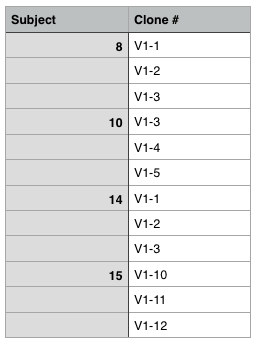
- I chose 3 clones from 4 subjects:
- Subjects: 15, 14, 10, and 8 (Use the data table below (Table 2) to keep a record of the data you analyzed.:)
- I chose 3 clones from 4 subjects:
- As a preliminary analysis you should generate a multiple sequence alignment and distance tree for 12 of these sequences (3 clones from each of 4 subjects).:
- Do the clones from each subject cluster together?
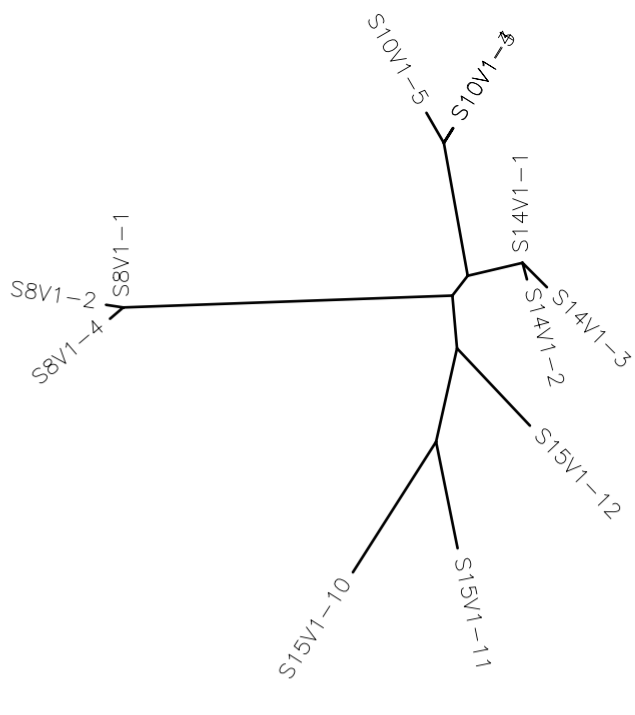
- Looking at the tree shown above, the clones look like they tend to cluster together for each subject. However, subject 15's clones do not cluster as much as the others
- Do some subjects’ clones show more diversity than others?
- There is generally less diversity between each subject's clones compared to other subjects, again with the exception of subject 15 which shows much more genetic diversity than any of the others
- This can be seen through the length of the lines separating the clones
- There is generally less diversity between each subject's clones compared to other subjects, again with the exception of subject 15 which shows much more genetic diversity than any of the others
- Do some of the subjects cluster together?
- Subjects 15, 14, and 10 are much more clustered together compared to subject 8
- Write a brief description of your tree and how you interpret the clustering pattern with respect to the similarities and potential evolutionary relationships between subjects’ HIV sequences:
- This tree shows that subjects 15, 14, and 10 are much more genetically related than they are to subject 8. Because subject 10's clones are extremely close this means that there is very little genetic diversity between the clones where as the clones of subject 15 are much farther apart and therefore more diverse. Subject 14's clones are also very similarly related.
- Select all the clones from one subject and align them. From the alignment calculate S. Enter your data into Table 3 below. Run the same analysis for a second and third subject and record your results in Table 3.:
- three subjects were selected; 5,9, and 2, and all clones were compared to find S, theta, and min and max difference as seen bellow
- S was found by finding the number of positions where there is at least one nucleotide difference across the collection of clones
- Calculate θ for the three subjects you chose to work with and enter the results in the datable:
- theta was then calculated using the equation
- ex. theta equation for subject 5: 8/((1/1)+(1/2)+(1/3)+(1/4)+(1/5))
- Then the min and max distance is found by multiplying the smallest number in the clustal distance matrix as seen bellow by the length of the sequence (285 in all cases) to find the min distance and the largest number by the length to find the max distance
- Use the Clustdist tool in the alignment tool set to generate a distance matrix for an alignment you saved. Select the highest and lowest pairwise scores and convert that percentage difference score into the raw number of differences by multiplying by the length of the sequence (285 in most cases):
- Then the distances are compared across 2 subjects by creating new CLUSTALW with each pairs of clones then running a CLUSTALDIST between each pair. The min and max differences are seen in the table bellow
Data and Files
FASTA HIV downloaded sequences
Tables used in this week's lab
Conclusion
In conclusion we found that some of the HIV sequences may have been more similar to each other than to others person to person, but most likely do not come from a single source. By looking at the tree provided in the methods and results section above (and the description added above), it is possible to see the differences between sequences by the distances between each sequence denoted by the length of the line between them. In this way we were able to fulfill the purpose by observing the clear differences between many of the sequences. We were also able to see the min and max differences between subjects 5,9, and 2. The minimum differences is consistent across the board for these comparisons at 1.14 while the largest max difference was between subjects 5 and 9 at 39.05.
Defining Our Research Project
- What is your question?
- Would a correlation analysis of sequence data from Markham et al. reveal a more informative trend between genetic diversity and decline in CD4 T cell counts than the categorical analysis that was done in the paper?
- Make a prediction (hypothesis) about the answer to your question before you begin your analysis.
- We predict that a correlation analysis across several data points from several subjects will indicate that there is a consistent trend between HIV genetic diversity and CD4 T cell count.
- Which subjects, visits, and clones will you use to answer your question?
- We will use data from subjects 6, 8, 9, and 14 because these subjects have the most data across the most number of visits through the trial. This means that these subjects were most compliant to the protocols outlined by the ALIVE study researchers and therefore may have the least number of non-project related influences on their health. We will use all clone data from all available visits to generate the correlation analysis, adding up to a total of 64 clones. If we find an analysis procedure that allows us to use more clones, we will continue to add subjects according to the number of visits they completed.
References
- Websites used:
- NCBI website http://www.ncbi.nlm.nih.gov
- article link: http://www.ncbi.nlm.nih.gov/pmc/articles/PMC22871/
- Markham, R. B., Wang, W.-C., Weisstein, A. E., Wang, Z., Munoz, A., Templeton, A., … Yu, X.-F. (1998). Patterns of HIV-1 evolution in individuals with differing rates of CD4 T cell decline. Proceedings of the National Academy of Sciences of the United States of America, 95(21), 12568–12573.
- article link: http://www.ncbi.nlm.nih.gov/pmc/articles/PMC22871/
- Biology Workbench website http://workbench.sdsc.edu
- NCBI website http://www.ncbi.nlm.nih.gov
- Week 4 Assignment Page
Acknowledgments
This work was done with help from my homework partner, Anu in class and with the help of our professor; Dr. Dahlquist. Anu and I met online and texted on Sunday afternoon to determine the subject of our research project and to answer the questions in the section "Defining Our Research Project." Anu and I wrote the section titled "Defining Our Research Project" together. While I worked with the people noted above, this individual journal entry was completed by me and not copied from another source. Mia Huddleston 15:45, 26 September 2016 (EDT)
Useful links
User Page: Mia Huddleston
Bioinfomatics Lab: Fall 2016
Class Page: Bioinfomatics Laboratory, Fall 2016


