Mia Huddleston Week 3
Electronic Lab Notebook
Purpose
The purpose of this activity is to use a set of HIV sequence data to study sequence evolution. This HIV data will come from 15 different subjects and to study it we will begin by learning about the dataset then about the possible sources the subjects could have gotten infected from.
Methods and Results
- To begin this activity I first found the PubMed record for the article; Markham et al. through the NCBI website by searching for the title of the article in the search bar. Then I went to the links section and clicked on nucleotide to find all of the nucleotide sequences within this article.
- From these sequences I chose S3V6-1 or subject 3, visit 2, first clone.
- The S3 references the subject while the V6 references the visit number.
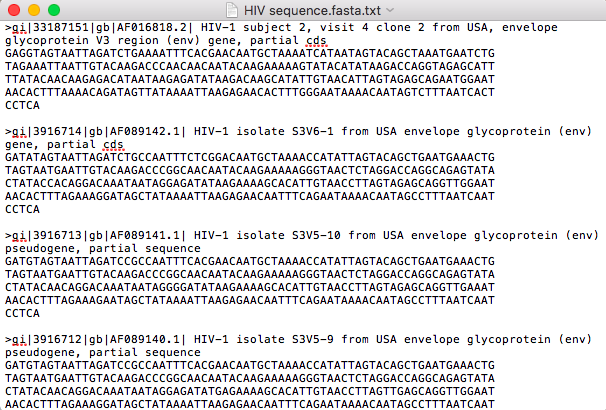
- I then downloaded 4 different sequences to my computer by selecting those 4 sequences and clicking on "send to" and then clicking on "File," then under format clicking "FASTA." This resulted in the text file seen in the image bellow.
- I then logged on to the biology workbench by going to the website http://workbench.sdsc.edu and setting up an account.
- Then I scrolled down and clicked on nucleic tools and selected add new sequence then run and then uploaded my sequences FASTA file and saved it onto my workbench.
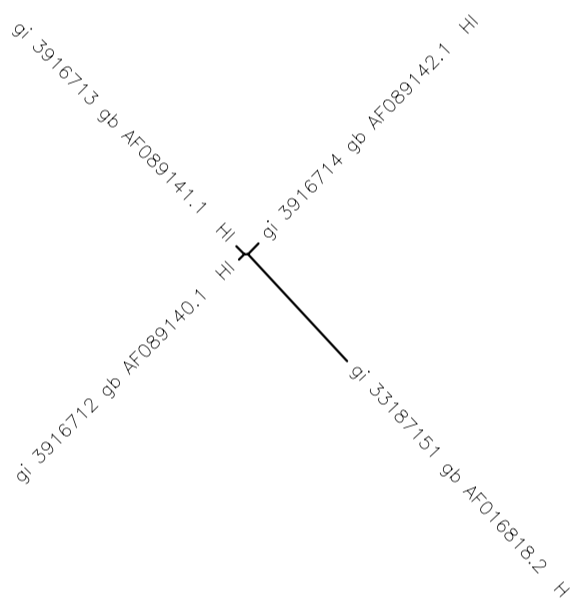
- To create a unrooted tree diagram I selected all of the sequences and clicked on "ClustalW" and submit and got the tree diagram shown in the image bellow.
- Three of the four branches seem to be more similar to each other than the fourth which has a longer black line connecting it to the rest.
Data and Files
FASTA HIV downloaded sequences
Conclusion
The tree created shows that three of the four sequences are very closely related as seen by the proximity to each other, while the fourth is quite different as seen by how far away it is. The three that are closest in relation are in fact from the same subject but different visits (subject 3). However, the non-similar one is from subject 2 on their 4th visit. Also, gi 3916713 and gi 3916712 are both from the same subject and the same visit (visit 5) and may be the two that are the most similar, although it is difficult to tell from the tree. This fulfilled the purpose because by learning how to create this tree and see how each sequence is connected we were able to study some aspects of sequence evolution.
Preparation for Week 4 Journal Club
10 Definitions from Article
- Seroconversion: “The stage in an immune response when antibodies to the infecting agent are first detected in the bloodstream. For example, people infected with HIV typically seroconvert about 4–6 weeks following the initial infection, when antibodies against viral proteins are first produced”
- Seropositive: “giving a positive result in a test of blood serum, e.g., for the presence of a virus”
- Chemostat: “An apparatus in which a bacterial population can be maintained in the exponential phase of growth by regulating the input of a rate-limiting nutrient and the removal of exhausted medium and cells.”
- Mononuclear cells: Blood monocytes and lymphocytes as opposed to erythrocytes and polymorphonulear leucocytes. Mononuclear phagocytes are monocytes and their differentiated products, macrophages
- Heterogeneity: "Variety or diversity, lack of uniformity; the variety of qualities found in an environment (habitat patches) or a population (genotypic variation). Contrast homogeneity."
- Epidemiological: Relating to the branch of medicine which deals with the incidence, distribution, and control of diseases
- Epitopes: “the antigenic determinant on an antigen to which the paratope on an antibody binds.”
- Chemokine: "Any of a class of cytokines with functions that include attracting white blood cells to sites of infection.”
- Cytolysis: " The dissolution or disruption of cells, especially by an external agent.”
- Proliferation: An increase in the size of a population of cells.
Outline
Introduction:
- HIV-1 can rapidly adapt to its environment though mutations
- The most successful adaptation would represent future generations
- This is commonly seen in other systems
- If the host environment has sudden changes, the future generations would all be very similar
- But, if instead an immune response only killed the most frequent type, then there could be lots of different types in the future generations
- Soon they would be immune to the human immune response
- Studying the different patterns of responses by the virus is critical
- Current HIV-1 research is much more comprehensive
- Previous studies either did not study sequence patterns or did not study their subjects enough which is what led to this research
- In this research, they instead studied 15 subjects at frequent intervals over a period of 4 years
- Previous studies either did not study sequence patterns or did not study their subjects enough which is what led to this research
- The significance of this work is to show that separate patterns generation to generation are seen between nonprogressor and normal/quickly progressing subjectsand that there is more genetic diversity when associated with rapid CD4 T cell decline
Methods:
- 15 participants
- visits every 6 months
- blood is collected for virologic and immunologic studies
- CD4 T cells were studied
- Rapid progressors had fewer than 200 CD4 T cells within 2 years of seroconversion
- Moderate: 200-650 within 4 years
- non: above 650 throughout observation period
- HIV-1 env gene is sequenced using Nested PCR
- plasma viral load was also determined using reverse transcription-PCR
- phylogenic tress were constructed
- a tree of clones from different subjects showed how the clones were independently segregated
- The correlation between the genetic diversity and CD4 T cell count after 1 year was studied
- 76 time points were observed from the subjects
- The differences between the two strains were either synonymous or non synonymous correcting for the bias towards nonsynomous
- The values of and ratio between dS and dN were averaged over all strains and a median value was observed
- Subjects 9 and 15 had a high genetic variation showing they may have been infected by separate viruses
- their phylogenic trees were studied
- Figure 1: The change over time of cell trajectory, diversity, and divergence for all subjects showing the similarities and differences between rapid, moderate, or nonprogessors
- Table 1: The summary of 15 seroconverters showing each subjects as rapid, moderate, or nonprogessors by their CD4 T numbers
- The rate of change of divergence and diversity was studied and compared using a regression line over time
- Figures 2a and 2b: Show the slopes of diversity and divergence in the different groups, rapid being the highest before moderate and non for both
- Figure 3: Shows the phylogenic tree from subject 9, each horizontal line shows a different mutation
Results:
- The results for changes in CD4 and serum viral load data were inconsistent person to person
- diversity and divergence increased as time went on in all categories and was greater from non to moderate to rapid
- rapid had much higher rate of increase in divergence than the others
- But the difference was not statistically significant
- same with diversity
- But the difference was not statistically significant
- the diversity and divergence vs. CD4 T cell count were negatively correlated
- SO subjects with greater genetic diversity/divergence were more likely to have a larger CD4 T cell decline over next year
- Figure 4: shows the phylogenic tress of 4 randomly selected subjects
Discussion:
- The results showed that viral strains from nonprogressors possibly indicated selection against aa change but progressors showed the opposite
- This conflict with other results from different studies
- but in agreement with some current studies showed that there was greater genetic variance in 3 of 5 rapid progressor studies
- The association between CD4 T cell decline and diversity was similar with other findings
- This study is limited in its time frame and may have been more successful wit ha larger amount of time to observe it's patients
- It may have also been more successful with a larger amount of people
- Since this article is quite old, it may be much more successful to repeat the experiment in the future with the technology that is now available
References
- Websites used:
- NCBI website http://www.ncbi.nlm.nih.gov
- article link: http://www.ncbi.nlm.nih.gov/pmc/articles/PMC22871/
- Markham, R. B., Wang, W.-C., Weisstein, A. E., Wang, Z., Munoz, A., Templeton, A., … Yu, X.-F. (1998). Patterns of HIV-1 evolution in individuals with differing rates of CD4 T cell decline. Proceedings of the National Academy of Sciences of the United States of America, 95(21), 12568–12573.
- article link: http://www.ncbi.nlm.nih.gov/pmc/articles/PMC22871/
- Biology Workbench website http://workbench.sdsc.edu
- NCBI website http://www.ncbi.nlm.nih.gov
Acknowledgments
This work was done with help from my homework partner, Courtney Merriam in class and with the help of our professor; Dr. Dahlquist. While I worked with the people noted above, this individual journal entry was completed by me and not copied from another source.
Useful links
User Page: Mia Huddleston
Bioinfomatics Lab: Fall 2016
Class Page: Bioinfomatics Laboratory, Fall 2016

