Leanne Kuwahara-Week 2
From OpenWetWare
Jump to navigationJump to search
Purpose
- To gain an understanding of the protocol of a DNA microarray experiment, as well as how the researcher interprets the data gained from the microarray.
Responses
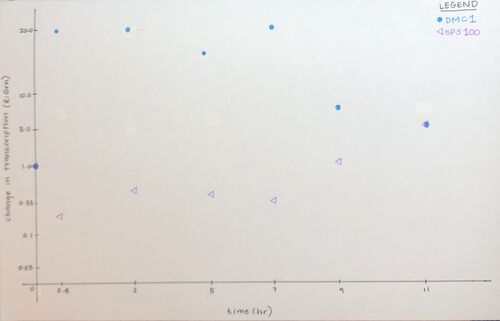 Figure 1. Scatter plot of the data given for genes DCM1 and SPS100 in figure 4.6b (Campbell & Heyer, 2003).
- At hour 1, all genes would be black. At hour 3, geneX would be dim red, geneY would be dim-medium red, and geneZ would be black-dim red. At hour 5, geneX would be black, geneY would be black-dim red, and geneZ would be dim red. Lastly, at hour 9, geneX would be medium green, geneY would be bright green, and geneZ would be dim red.
- Genes X and Y were transcribed similarly. In both, at time t=1hr there was no change in gene transcription, then at time t=3hr both genes were induced, although at different densities. Next, at time t=5hr, both genes were repressed, and finally at time t=9hr both genes were repressed further. Gene Z was expressed differently as it was continuously induced, seeming to peak at a 2X induction.
- The yellow dots represent no change in gene expression (i.e. 1:1 Red:Green ratio). At time t=0 (initial time point), it makes sense that most of the dots would be yellow as the environmental condition/stressor has not been induced yet, and the cell would not have had the chance to make any changes to their gene expression.
- TEF4 was repressed over the course of the experiment. This may be because the cell would be under starvation conditions and would likely save any remaining energy, or use it towards the process of gluconeogenesis, as opposed to using it to produce proteins it does not need.
- TCA Cycle genes would be induced to initiate gluconeogenesis, or produce more ATP as a product of the TCA Cycle and Oxidative Phosphorylation. As stated in the text, pyruvate decarboxylase would be repressed, resulting in the build up of pyruvate molecules. These can then be converted to oxaloacetate. Oxaloacetate can then be used in either the TCA Cycle or gluconeogenesis. It is also stated that PEP carboxykinase and fructose-1,6-bisphosphatase were induced, which convert oxcaloacetate into glucose-6-phosphate which will be stored by trehalose synthase and glycogen synthase.
- The genome could use regulatory transcription factors to ensure certain enzymes are induced and repressed simultaneously. Cells also have the ability to initiate control point in metabolic pathways, in which the product of one reaction will inhibit another.
- At the later time points in the described experiment, glucose would be low and the repressor TUP1p would be deleted. This would result in the induction of glucose-repressed genes and the spots would be red in color.
- Similarly, to number 8, at the later time points in the experiment, glucose would be low and the cell would be under stress. This would induce the Yap1p target genes and the spot would be red in color.
- The researcher could verify their deletion/overexpression by comparing the intensities of the gene spot on the microarray to that of a normally expressed gene (control). In both cases, the spot should be a much more intense/bright red than the control array.
Acknowledgements
- Ava Lekander
- We corresponded through text message to clarify certain aspects of the questions asked.
- Except for what is noted above, this individual journal entry was completed by me and not copied from another source.
References
- Campbell, A. M., & Heyer, L. J. (2003). "Chapter 4: Basic Research with DNA Microarrays", in Discovering Genomics, Proteomics, and BIoinformatics, Cold Spring Harbor Laboratory Press, pp.107-124.
- Dahlquist, K. & Fitpatrick, B. (2019). "BIOL388/S19: Week 2" Biomathematical Modeling, Loyola Marymount University. Accessed from:Week 2 Assignment Page
Links
- Assignment Pages:
- Individual Assignment Link:
- Week 1- Create User Page: Leanne K. Kuwahara
- Leanne Kuwahara-Week 2
- Leanne Kuwahara-Week 3
- Leanne Kuwahara-Week 4/5
- Leanne Kuwahara-Week 6
- Leanne Kuwahara-Week 7
- No week 8 assignment
- Leanne Kuwahara-Week 9
- Leanne Kuwahara-Week 10
- Leanne Kuwahara-Week 11
- Leanne Kuwahara-Week 12
- No week 13 assignment
- Leanne Kuwahara-Week 14/15
- Class Journal Page:
- Class Journal-Week 1
- Class Journal-Week 2
- Class Journal-Week 3
- Week 4 shared journal assignment extended to week 5
- Class Journal-Week 5
- Class Journal-Week 6
- Class Journal-Week 7
- No week 8 assignment
- Class Journal-Week 9
- Class Journal-Week 10
- Class Journal-Week 11
- Class Journal-Week 12
- No week 13 assignment
- Class Journal-Week 14/15
- BIOL388 Home Page: BIOL388
- User page: Leanne K. Kuwahara
