Leanne Kuwahara-Week 7
Purpose
To analyze the output obtained through the GRNmap analysis and propose in silico experiments to further study the data and gene expression.
Protocol
Analyzing Results of First Model Run
Here is what you need to consider when analyzing the results of your model
- What is the overall least squares error (LSE) for your model?
- You will find this on the "optimization_diagnostics" worksheet of your output workbook
- Since the input data are noisy, the model can only minimize the error so far. It is more "fair" to look at the ratio of the least squares error to the minimum theoretical least squares error that the model could have achieved given the data. We call this the LSE:minLSE ratio. You should be able to compute it with the values given on the "optimization_diagnostics" worksheet
- We will compare the LSE:minLSE ratios for the ten models run by everyone in the class
- You need to look at the individual fits for each of the genes in your model.
- Look at the individual expression plots to see if the line that represents the simulated model data is a good fit to the individual data points
- PDR1 has an odd peak at the beginning where there are no data points, but rest of data fits relatively well
- Look at the individual expression plots to see if the line that represents the simulated model data is a good fit to the individual data points
- Upload your output Excel spreadsheet to GRNsight. Use the dropdown menu on the left to choose the data you will display on the nodes (boxes). Compare the actual data for a strain with the simulated data (optimized) from the same strain
- If the model fits the data well, the color heatmap superimposed on the node will match top and bottom
- If the fit is poor, the colors will NOT match
- Make bar charts for the b and P parameters
Tweaking the Model: Deletion of ZAP1
- Purpose: To determine if the deletion of ZAP1 from the regulatory matrix would improve the reliability of the model generated in GRNmap and GRNsight
- ZAP1 was deleted as it was consistently modeled poorly and only made one connection in the regulatory matrix
- ZAP1 data was deleted from all worksheets on the GRNmapInput_dGLN3_LK Excel file
- The ZAP1 expression data worksheet was also deleted from the Excel file
- Control: Excel workbook containing estimation parameters for ZAP1, but NOT the ZAP1 expression data worksheet
- Ensured that any changes to the model come from removing the gene from the matrix and not the removal of the expression data
- Both the control and the -ZAP1 were run in GRNmap and GRNsight as described in the Week 6 assignment
Results
Part 1: GRNmap Gene models
- LSE = 0.9228
- LSE:minLSE Ratio = 1.551
- GRNmap Gene Model Fit
Table 1. Demonstrates whether optimized data reflected the experimental data input into GRNmap. '+' means model fit well, '-' means the model fit poorly.
| ACE2 | ASG1 | GCR2 | GLN3 | HAP4 | MIG2 | MSN2 | PDR1 | PDR3 | RIM101 | SFP1 | SWI5 | YAP1 | YOX1 | ZAP1 | |
| WT | + | + | - | + | + | + | + | + | + | + | + | + | + | + | - |
| dGLN3 | - | + | + | + | + | + | + | + | - | + | + | + | - | - | - |
| dHAP4 | + | - | + | + | + | + | + | + | + | + | + | + | + | + | + |
| dZAP1 | + | - | + | + | + | - | + | + | + | + | + | + | + | - | - |
Part 2: GRNsight Gene Regulatory Model
- GRNsight Gene Regulatory Model
- 15 nodes
- 25 edges
Table 2. Demonstrates whether optimized data reflected the experimental data using the regulatory model from GRNsight. Unoptimized and optimized strains were compared for analysis. '+' means model fit well, '-' means the model fit poorly.
| ACE2 | ASG1 | GCR2 | GLN3 | HAP4 | MIG2 | MSN2 | PDR1 | PDR3 | RIM101 | SFP1 | SWI5 | YAP1 | YOX1 | ZAP1 | |
| WT | + | - | - | + | - | + | + | - | - | + | + | + | + | + | - |
| dGLN3 | - | + | - | - | + | + | - | + | - | + | + | + | - | - | - |
| dHAP4 | + | + | + | + | + | + | + | - | + | + | + | + | + | + | - |
| dZAP1 | - | - | + | + | + | + | + | - | + | + | - | + | + | + | - |
Table 3. Total weights of activation and repression, and Benjamini and Hochberg p-values for each gene
| ACE2 | ASG1 | GCR2 | GLN3 | HAP4 | MIG2 | MSN2 | PDR1 | PDR3 | RIM101 | SFP1 | SWI5 | YAP1 | YOX1 | ZAP1 | |
| Total Weight of Activation | 0 | 0 | 0 | 0 | 1.0025 | 10.00 | 0.9676 | 0 | 0.91859 | 0 | 0.4350 | 2.441 | 3.133 | 0 | 0 |
| Total Weight of Repression | -3.222 | 0 | 0 | -0.14939 | -2.832 | -4.709 | 0 | -10.00 | -0.2767 | 0 | -0.5160 | -0.2767 | -1.059 | -1.710 | -1.778 |
| B-H p-value | 0.767 | 0.879 | 0.851 | 0.585 | 0.067 | 0.003 | 0.282 | 0.233 | 0.152 | 0.754 | 0.065 | 0.254 | 0.081 | 0.169 | 0.107 |
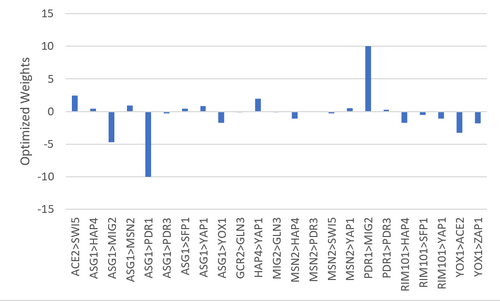
Figure 1. Bar chart depicting the optimized weights for each gene interaction.
- Many genes change their expression during cold shock, notably MIG2 and PDR1 are the most strongly activated and repressed respectively. See Table 2 for more information.
Part 3: Parameter Rates & Threshold Bar Charts
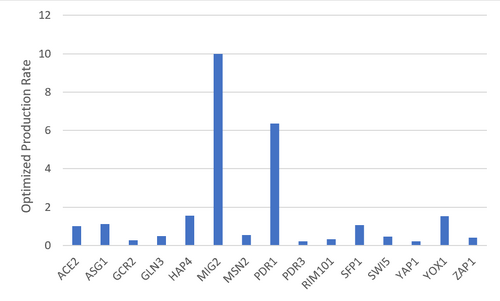
Figure 2. Bar chart depicting the optimized production rates for each gene.
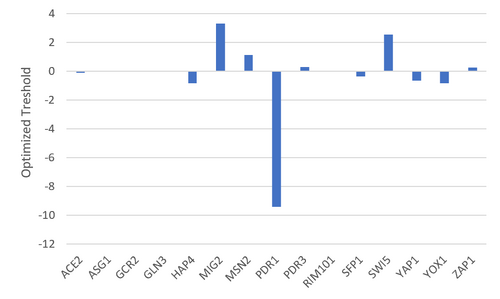
Figure 3. Bar chart depicting the optimized thresholds for each gene.
- There does not appear to be a correlation between the parameters and whether the model fit the data well.
Part 4: In silico experiment: Deletion of ZAP1
Input files (in BOX)
- BOX filename: WithoutZAP1_GRNmapInput_dGLN3_LK
- BOX filename: Control_WithoutZAP1_GRNmapInput_dGLN3_LK
Table 4. Comparison of the number of nodes, edges, and LSE:min LSE ratios for the control data set and the -ZAP data set
| Control | -ZAP1 | |
| nodes | 14 | 24 |
| edges | 14 | 24 |
| LSE:min LSE | 1.505044 | 1.450351 |
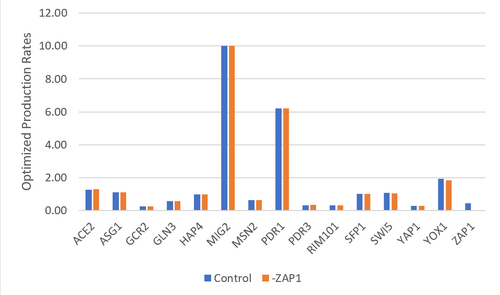
Figure 4. Bar chart depicting the optimized production rates for each gene. The control data set was compared to the data set where ZAP1 was excluded.
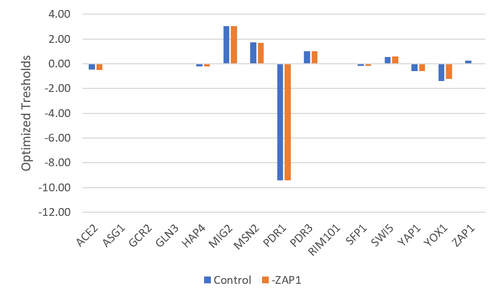
Figure 5. Bar chart depicting the optimized thresholds for each gene. The control data set was compared to the data set where ZAP1 was excluded.
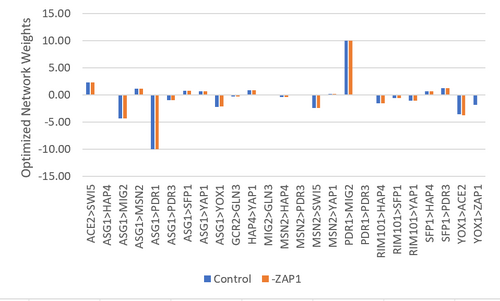
Figure 6. Bar chart depicting the optimized network weights for each gene. The control data set was compared to the data set where ZAP1 was excluded.
Conclusion
The purpose of this assignment was to analyze the regulatory matrix in GRNmap and evaluate how well the outcome model fit our data. The GRNmap produced a model with a LSE:minLSE ratio of 1.551 and it appeared that the model fit certain genes better than others (Table 1 & 2), however it is undetermined as to why as these consistencies did not correlate with any parameter trends. It was proposed that the deletion of ZAP1 from the regulatory matrix would improve the model as it only makes a single connection (being regulated by YOX1) and seems to consistently model poorly. A control data set was also run for comparison purposes, where the dZAP1 expression data sheet was deleted, but the ZAP1 estimates remained. While the model did improve, the improvement was minimal (change in LSE:minLSE=0.05). It remains undetermined as to why there was a slight improvement in the fit of the model as there do not to seem to be any correlations to the parameters (Figures 4, 5, & 6), or the number of nodes and edges (Table 4).
- Overall, it is likely that ASG1, MIG2, and PDR1 have an important role in transcriptional regulation during cold shock. ASG1 regulated the most genes in the regulatroy matrix generated in GRNmap, adn is known to be an activator of stress response genes in fatty acid utilization. This gene has been found to be required for the full activation of genes involved in gluconeogenesis, B-oxidation, glyoxylate cycle, triacylglycerol breakdown, and peroxisomal transport (Jansuriyakul et al., 2016). MIG2 had the highest threshold, meaning that it is not always on, and the highest production during cold shock. This genes is known to have a role in glucose repression, and represses genes required to metabolize poor-carbon sources when glucose is present (Karunanithi & Cullen, 2012). Lastly, PDR1 was the most repressed target, but the strongest activator (of MIG2). It is a Pleiotrophic Drug Resistance gene, and is known to be involved in membrane permeability. This may be important during cold shock as the fluidity of the membrane decreases in low temperatures (Balzi et al., 2987).
Acknowledgements
- Assigned Homework Partner: Austin Dias
- -Texted a few times to compare data and clarify aspects of the assignment.
- Used syntax from the "wiki:Help-Tables" page to create tables.
- Except for what is noted above, this individual journal entry was completed by me and not copied from another source.
References
- Balzi, E., Chen, W., Ulaszewski, S., Capieaux, E., & Goffeau, A. (1987). The multidrug resistance gene PDR1 from Saccharomyces cerevisiae. Journal of Biological Chemistry, 262(35), 16871-16879.
- Dahlquist, K. & Fitpatrick, B. (2019). "BIOL388/S19: Week 7" Biomathematical Modeling, Loyola Marymount University. Accessed from:Week 7 Assignment Page
- Jansuriyakul, S., Somboon, P., Rodboon, N., Kurylenko, O., Sibirny, A., & Soontorngun, N. (2016). The zinc cluster transcriptional regulator Asg1 transcriptionally coordinates oleate utilization and lipid accumulation in Saccharomyces cerevisiae. Applied microbiology and biotechnology, 100(10), 4549-4560.
- Karunanithi, S., & Cullen, P. J. (2012). The filamentous growth MAPK pathway responds to glucose starvation through the Mig1/2 transcriptional repressors in Saccharomyces cerevisiae. Genetics, 192(3), 869-887.
Links
- Assignment Pages:
- Individual Assignment Link:
- Week 1- Create User Page: Leanne K. Kuwahara
- Leanne Kuwahara-Week 2
- Leanne Kuwahara-Week 3
- Leanne Kuwahara-Week 4/5
- Leanne Kuwahara-Week 6
- Leanne Kuwahara-Week 7
- No week 8 assignment
- Leanne Kuwahara-Week 9
- Leanne Kuwahara-Week 10
- Leanne Kuwahara-Week 11
- Leanne Kuwahara-Week 12
- No week 13 assignment
- Leanne Kuwahara-Week 14/15
- Class Journal Page:
- Class Journal-Week 1
- Class Journal-Week 2
- Class Journal-Week 3
- Week 4 shared journal assignment extended to week 5
- Class Journal-Week 5
- Class Journal-Week 6
- Class Journal-Week 7
- No week 8 assignment
- Class Journal-Week 9
- Class Journal-Week 10
- Class Journal-Week 11
- Class Journal-Week 12
- No week 13 assignment
- Class Journal-Week 14/15
- BIOL388 Home Page: BIOL388
- User page: Leanne K. Kuwahara
