Leanne Kuwahara-Week 12
Purpose
To gain a better understanding of chemostat models and to modify the chemostat MATLAB scripts to simulate a 2-nutrient chemostat model.
Protocol
Equations
Biomass rate of change: dx/dt = x[r(y/y+K)(z/z+L)] - qx
Glucose rate of change: dy/dt = -Ex[r(y/y+K)(z/z+L)] - qy + qu
Ammonium rate of change: dz/dt = -Fx[r(y/y+K)(z/z+L)] - qz + qv
- q: dilution rate (1/hr)
- At equilibrium: q = specific growth rate
- V: culture volume (L)
- u/v: feed concentration (g/L)
- r: MAX specific growth rate (1/hr)
- K/L: [substrate] at half MAX specific growth rate (g/L)
- E/F: efficiency of converting nutrients to biomass (unitless)
- x(t): residual biomass (g)
- y(t): residual glucose (g)
- z(t): residual ammonium (g)
AT EQULILIBRIUM production rate = consumption rate
- rate of change = ZERO!
- r(y/y+K)(z/z+L) = q
- For glucose: x = u-y/E
- For ammonium: x = v-z/F
Tai et al. (2007) Questions
- The yield quantity Y(glu/x) is a ratio of what quantities? Relate this to the 2-nutrient model developed in class.
- The amount of glucose converted to biomass (Pizzaro et al., 2008; Manesh, 2012)
- g of biomass produced : g of glucose consumed
- The amount of glucose converted to biomass (Pizzaro et al., 2008; Manesh, 2012)
- The flux q(glu) is a ratio of what quantites? Relate this to the 2-nutrient model developed in class.
- glucose consumption rate (Sauer et a., 1999; Manesh, 2012)
- specific growth rate : Y(glu/x)
- glucose consumption rate (Sauer et a., 1999; Manesh, 2012)
- Convert the residual glucose and ammonium from mM to g.
- mmol/L * culture volume (1L) / 1000mmol * MM of: glucose (180.156g/mol); ammonium (18.039g/mol)
- Determine the length of time the chemostat was operated before data was collected.
- Biomass dry weight, metabolites, dissolved oxygen, and gas profiles were constant for at least 3 volume changes before sampling.
- Since culture volume was 1L, 3L was divided by the dilution rate (0.03 h-1)
- Biomass dry weight, metabolites, dissolved oxygen, and gas profiles were constant for at least 3 volume changes before sampling.
- Determine as many model parameters as you can from the given data.
Two-Nutrient MATLAB Simulation
- In chemostat_dynamics_TwoNutrient (function)
- Added parameters v, L, and F
- Added variable z (for ammonium--changed y to be for glucose only)
- Added differential equation dzdt for ammonium and altered the specfic growth rate parameter to include ammonium (ryz)
- ryz = r*(y/(K+y))*(z/(L+z))
- dzdt = q*(v - z) - fp*ryz*x;
- Added state variable dSdt (3) to be dzdt
- In chemostat_script_TwoNutrient (script)
- Added an initial ammonium concentration and added it as an initial state for the differential equation
- Added variable v, L and F and assigned them to a parameter vector
- Added ammonium into the legend
PARAMETERS:
- C-limited parameters:
- q = 0.03hr-1
- u = 25g/L
- v = 5g/L
- r = 0.46hr-1
- K = 0.778g/L
- L = 15.91g/L
- E = 14.3 g(glu)/g(dw)
- F = 2.23 g(NH4)/g(dw)
- x0 = 1g/L
- y0 = 2g/L
- z0 = 1.11g/L
- N-limited parameters:
- q = 0.03hr-1
- u = 46g/L
- v = 0.65g/L
- r = 0.46hr-1
- K = 0.778g/L
- L = 15.91g/L
- E = 25 g(glu)/g(dw)
- F = 0.526 g(NH4)/g(dw)
- x0 = 1g/L
- y0 = 20g/L
- z0 = 3.5g/L
Results
Tai et al. (2007) Paper Questions
- Y(glu/x) = g of biomass produced / g of glucose consumed
- biomass = x
- glucose consumed (y) = u - residual glucose
- q(glu) = specific growth rate / Y(glu/x)
- specific growth rate = q
- Residuals:
- Glucose:
- Glu limited (12C): 0.50g
- Glu limited (30C): 0.054g
- Amm limited (12C): 16.2g
- Amm limited (30C): 15.3g
- Ammonium:
- Glu limited (12C): 1.17g
- Glu limited (30C): 1.11g
- Amm limited (12C): 0.027g
- Amm limited (30C): 0.0036g
- Glucose:
- It took approximately 100hr for the chemostat to reach a steady state
- Model parameters (from Tai et al. papers 2005 & 2007):
- q = μ = 0.03hr-1
- V = 1L
- u(glu) = 25g/L (C-limited); 46g/L (N-limited)
- v(NH4+) = 5.0g/L (C-limited); 0.65g/L (N-limited)
- r = ???
- r > q
- r was set to be the same as Lievense's data in the Boyd paper. This group used a glucose concentration similar to ours and determined r using a Lineweaver-Burk plot.
- r = 0.46hr-1
- r was set to be the same as Lievense's data in the Boyd paper. This group used a glucose concentration similar to ours and determined r using a Lineweaver-Burk plot.
- r > q
- K = (ry/q)-y (g/L)
- L = (rz/q)-z (g/L)
- E = 1/Y(glu/x)
- F = (v-z)/x
MATLAB Manipulation
Plots give residual concentrations IN chemostat after conversion to biomass
- First attempt script: try 1
- Got better after removing parameters E and F
- Second attempt script: try 2
- Third attempt script: try 3
- MATLAB files: used TwoNutrient files
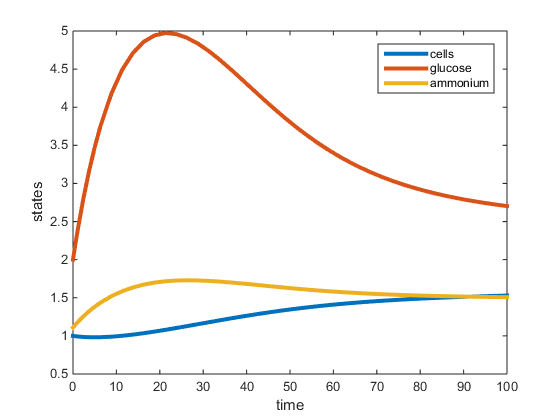
Figure 1. Plot of two-nutrient chemostat simulation of carbon limited cultures at 30C. All data was obtained from the Tai et al. papers (2005, 2007) except for values r, K, and L. The r was determined to be the max specific growth rate given by Lievense in the Boyd paper and was used to determine K and L. This graph depicts the residual concentrations of what is in the chemostat at equilibrium.
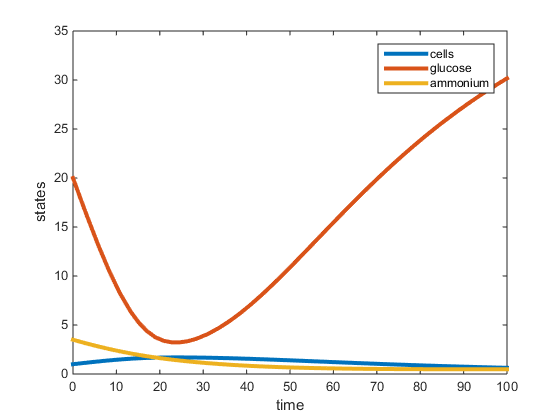
Figure 2. Plot of two-nutrient chemostat simulation of nitrogen limited cultures at 30C. All data was obtained from the Tai et al. papers (2005, 2007) except for values r, K, and L. The r was determined to be the max specific growth rate given by Lievense in the Boyd paper and was used to determine K and L. This graph depicts the residual concentrations of what is in the chemostat at equilibrium.
Conclusion
The purpose of this assignment was to modify the chemostat MATLAB scripts to simulate a 2-nutrient chemostat model using the data provided from the Tai et al. papers (2005, 2007). The model does show the system going to a steady state for both the C and N-limited experiments at 30C, however the steady state values (residual concentrations) were different from those provided in the paper. In our model, for the C-limited culture at 30C, the steady state concentration of glucose was around 2.7g/L, and the steady-state concentrations of ammonium and yeast were around 1.5g/L. This is opposed to the Tai (2007) paper which had the residual glucose to be 0.054g/L, residual ammonium at 1.11g/L and the cell population at 1.74g/L. In the N-limited cultures at 30C, our model shows that glucose had not reached a steady state at 100hr, and the steady-state ammonium and cell population to be around 1g/L. The Tai (2007) paper states the residual glucose to be 15.3g/L, residual ammonium to be 0.0036g/L, and the cell population to be 1.228g/L. In both cultures, the yeast steady-state was the most similar to that provided by Tai et al. (2007), however the glucose and ammonium residual concentrations were not accurate. This may be because the Tai et al (2007) paper did not specify what the maximum specific growth rate (r) was, which was required for our model. In the model run, r was obtained from an outside paper (Boyd, 1985) which provided an r-value under conditions similar to those in the Tai et al (2007) paper.
Acknowledgements
- Assigned Homework Partner: Fatimah Alghanem
- Except for what is noted above, this individual journal entry was completed by me and not copied from another source.
References
- Boyd, C. G. (1985). GROWTH PARAMETERS FOR SACCHAROMYCES CEREVISIAE IN GLU(X)SE CONTAINING MEDIA. Taxas Tech University. 26-28.
- Dahlquist, K. & Fitpatrick, B. (2019). "BIOL388/S19: Week 12" Biomathematical Modeling, Loyola Marymount University. Accessed from:Week 12 Assignment Page
- Manesh, T. (2012). "How do I calculate the biomass yield on glucose?" Gujarat State Biotechnology Mission. Accessed from: https://www.researchgate.net/post/How_do_i_calculate_the_biomass_yield_on_glucose
- Pizarro, F. J., Jewett, M. C., Nielsen, J., & Agosin, E. (2008). Growth temperature exerts differential physiological and transcriptional responses in laboratory and wine strains of Saccharomyces cerevisiae. Appl. Environ. Microbiol., 74(20), 6358-6368.
- Sauer, U. W. E., Lasko, D. R., Fiaux, J., Hochuli, M., Glaser, R., Szyperski, T., ... & Bailey, J. E. (1999). Metabolic flux ratio analysis of genetic and environmental modulations of Escherichia coli central carbon metabolism. Journal of bacteriology, 181(21), 6679-6688.
- Tai, S. L., Boer, V. M., Daran-Lapujade, P., Walsh, M. C., de Winde, J. H., Daran, J. M., and Pronk, J. T. (2005). Two-dimensional transcriptome analysis in chemostat cultures: combinatorial effects of oxygen availability and macro- nutrient limitation in Saccharomyces cerevisiae. J. Biol. Chem. 280, 437–447.
- Tai, S. L., Daran-Lapujade, P., Walsh, M. C., Pronk, J. T., & Daran, J. M. (2007). Acclimation of Saccharomyces cerevisiae to low temperature: a chemostat-based transcriptome analysis. Molecular Biology of the Cell, 18(12), 5100-5112. DOI: 10.1091/mbc.e07-02-0131
Links
- Assignment Pages:
- Individual Assignment Link:
- Week 1- Create User Page: Leanne K. Kuwahara
- Leanne Kuwahara-Week 2
- Leanne Kuwahara-Week 3
- Leanne Kuwahara-Week 4/5
- Leanne Kuwahara-Week 6
- Leanne Kuwahara-Week 7
- No week 8 assignment
- Leanne Kuwahara-Week 9
- Leanne Kuwahara-Week 10
- Leanne Kuwahara-Week 11
- Leanne Kuwahara-Week 12
- No week 13 assignment
- Leanne Kuwahara-Week 14/15
- Class Journal Page:
- Class Journal-Week 1
- Class Journal-Week 2
- Class Journal-Week 3
- Week 4 shared journal assignment extended to week 5
- Class Journal-Week 5
- Class Journal-Week 6
- Class Journal-Week 7
- No week 8 assignment
- Class Journal-Week 9
- Class Journal-Week 10
- Class Journal-Week 11
- Class Journal-Week 12
- No week 13 assignment
- Class Journal-Week 14/15
- BIOL388 Home Page: BIOL388
- User page: Leanne K. Kuwahara

