Leanne Kuwahara-Week 14/15
From OpenWetWare
Jump to navigationJump to search
Purpose
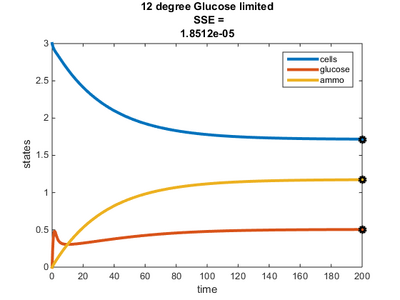
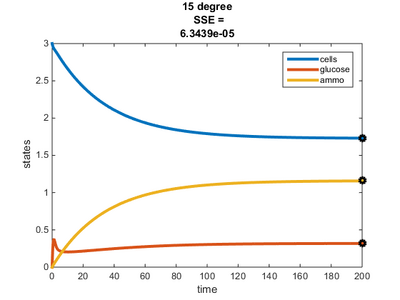
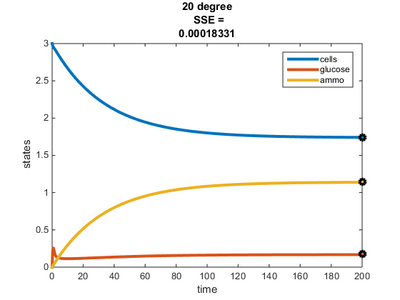
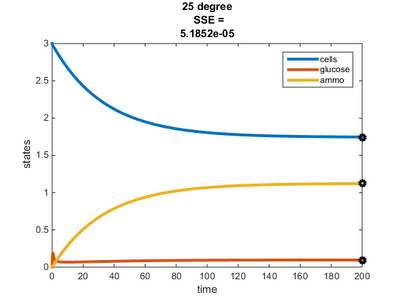
- To model temperature dependence of a chemostat experiment at 15, 20, and 25C.
- To investigate the glucose efficiency and waster "constant" for the glucose and ammonium-limited cultures.
Protocol
- Temperature dependence modeling:
- Arrhenius equations used:
- (1) k = Ae^(-Ea/RT)
- (2) Ea = (Rln(k1/k2))/(1/T1-1/T2)
- k = rate (r)
- k1 = r cold (0.08)
- k2 = r hot (0.46)
- A = frequency factor
- related to molecular collision
- dependent on reaction
- Ea = energy of activation
- R = gas constant (8.3145J/mol K)
- T = temperature (K)
- T1 = T cold (12C)
- T2 = T hot (30C)
- k = rate (r)
- Arrhenius equations used:
- Determined Ea using equation 2 and then plugged into equation 1 to find A
- Used equation 1 with T = 15, 20, 25C to determine r at these temperatures
- Modeled temperature dependence in MATLAB
- Added three conditions/cases (T = 15, 20, 25C) to the TaiParams sheet
- Used C-limited conditions determined from paper for feed concentrations of glucose and ammonium, residual concentrations of glucose and ammonium, and Y(glu/x)
- Efficiency/Waste Modeling:
- Yeast produce more waste (EtOH and CO2) when glucose is plentiful
- Waste is relatively equal between temperatures
- Prefer fermentation vs. respiration
- Compared efficiency of glucose conversion to biomass in C-limited cultures vs. N-limited cultures
- Used (y,E) of C-limited and N-limited at 12 or 30C
- Solved for m using y-y = m(x-x)
- Solved for b using y = mx+b
- Solved for efficiency using my+b, where y is the residual glucose
Results
Part 1. Temperature Dependence
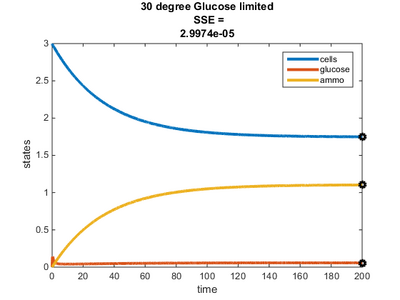
- Residual glucose decreases as temperature increases
- All plots were generated under the assumption of the limiting nutrient being glucose
- Residual concentrations of ammonium and glucose were adjusted to be within the range provided by the Tai et al. (2007) paper to best fit the model
Part 2. Efficiency/Waste Modeling
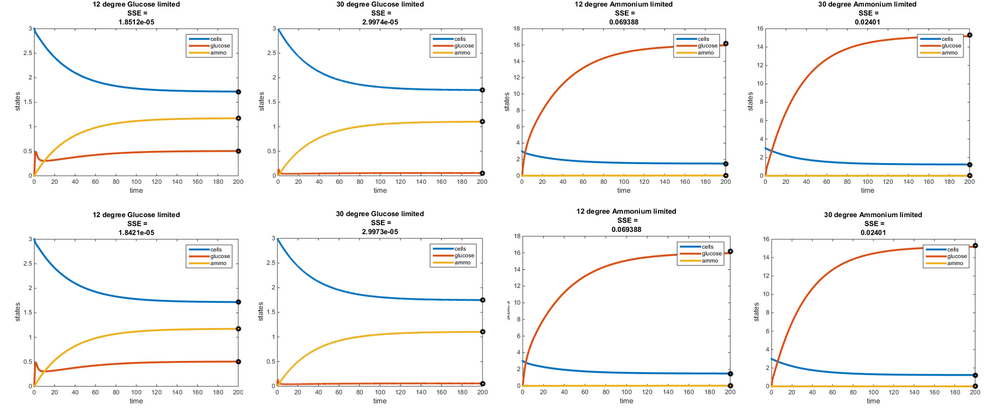
- top: Original model where E = 1/Y
- E(12C, C-lim) = 14.2857
- E(12C, N-lim) = 20.0000
- E(30C, C-lim) = 14.2857
- E(30C, N-lim) = 25.0000
- bottom: Effciency modified, where E = my + b
- 12C: m = 0.364532365; y = residual glucose (g) b = 14.08867026
- 30C: m = 0.701234358; y = residual glucose (g) b = 14.24776322
- E(12C, C-lim) = 14.2741
- E(12C, N-lim) = 20.0089
- E(30C, C-lim) = 14.2879
- E(30C, N-lim) = 24.9987
Data and Files
Acknowledgements
- Assigned Homework Partner: Desiree Gonzalez
- Met to work on assignment
- Except for what is noted above, this individual journal entry was completed by me and not copied from another source.
References
- Dahlquist, K. & Fitpatrick, B. (2019). "BIOL388/S19: Week 114/15" Biomathematical Modeling, Loyola Marymount University. Accessed from:Week 14/15 Assignment Page
- Del Mundo, G., Moussa, K., Chacha, P., Odufalu, F., Mudda, G., Kan, Kelvin F. C. (2019). Arrhenius Equation. Chemistry LibreTexts.
Links
- Assignment Pages:
- Individual Assignment Link:
- Week 1- Create User Page: Leanne K. Kuwahara
- Leanne Kuwahara-Week 2
- Leanne Kuwahara-Week 3
- Leanne Kuwahara-Week 4/5
- Leanne Kuwahara-Week 6
- Leanne Kuwahara-Week 7
- No week 8 assignment
- Leanne Kuwahara-Week 9
- Leanne Kuwahara-Week 10
- Leanne Kuwahara-Week 11
- Leanne Kuwahara-Week 12
- No week 13 assignment
- Leanne Kuwahara-Week 14/15
- Class Journal Page:
- Class Journal-Week 1
- Class Journal-Week 2
- Class Journal-Week 3
- Week 4 shared journal assignment extended to week 5
- Class Journal-Week 5
- Class Journal-Week 6
- Class Journal-Week 7
- No week 8 assignment
- Class Journal-Week 9
- Class Journal-Week 10
- Class Journal-Week 11
- Class Journal-Week 12
- No week 13 assignment
- Class Journal-Week 14/15
- BIOL388 Home Page: BIOL388
- User page: Leanne K. Kuwahara
