Angela C Abarquez Week 15
Purpose
The purpose is to use MATLAB to create models of the temperature dependence of the chemostat reaction demonstrated in the Tai et al. (2007) paper. Additionally the glucose efficiency constant was further investigated and modified to account for the differing metabolization processes that yeast undergo under different conditions.
Methods
The MATLAB files provided by Dr. Fitzpatrick linked (here) were used.
Modeling Temperature Dependence
- The Arrhenius equation (rate = A*e^(-B/(R*T)) was used on each of the four cases (glucose-limited and ammonium-limited for 12 and 30 degrees C) to solve for A and B.
- The r and T values were taken from the "taiParamsRevised" MATLAB file and input into the equation, along with the universal gas constant R, to solve for A and B.
- The rates for then found for T = 15, 20, and 25 degrees C.
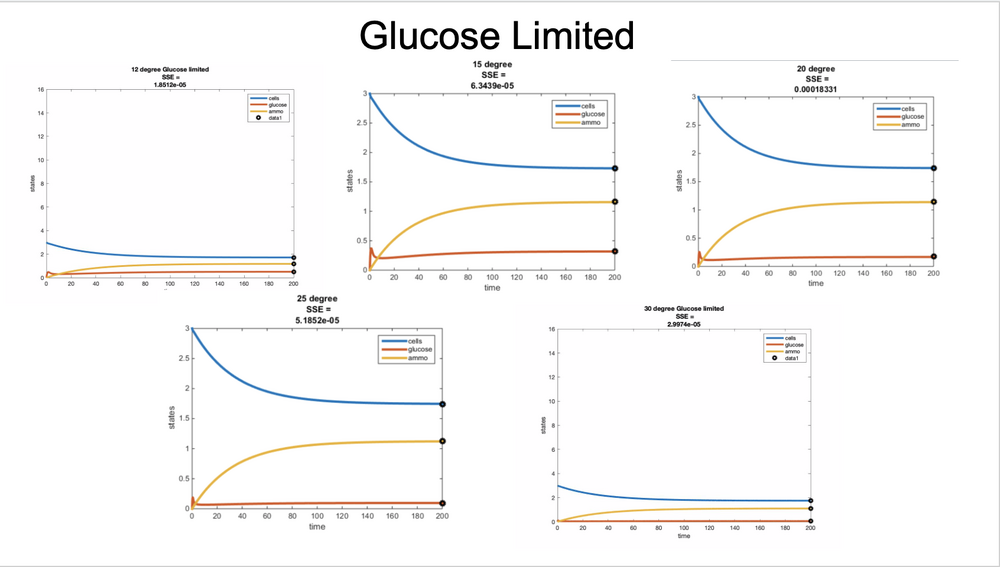
- The chemostat was then simulated for T = 15, 20, and 25 degrees C conditions. The time courses of the biomass and nutrients were graphed.
Investigating the Efficiency 'Constant'
- The y and E values were taken from the "taiParamsRevised" MATLAB file for all four cases.
- Using the point-slope and slope-intercept formulas, an equation for each temperature E(y) was created to relate the two points, (y,E).
- The "chemostat_2nutrient_dynamics.m" file was modified to use the two developed equations.
- Results were compared to the previous ones.
Results
Variables found in "taiParamsRevised" file:
12 degree C Glucose-Limited:
- r=0.08
- T=285.15K
- y=0.504504
- E=14.2857
30 degree C Glucose-Limited:
- r=0.46
- T=303.15K
- y=0.054054
- E=14.2857
12 degree C Ammonium-Limited:
- r=0.08
- T=285.15K
- y=16.2162
- E=20.0000
30 degree C Ammonium-Limited:
- r=0.46
- T=303.15K
- y=15.3333
- E=25.0000
Variables calculated using Arrhenius equation:
A = 4.979 * 10^11
B = 69,840.58946
r(15 degrees C) = 0.1087
r(20 degrees C) = 0.1787
r(25 degrees C) = 0.289
Equations developed using point-slope and slope-intercept formulas:
12 degree C: E = 0.3637y + 14.1022
30 degree C: E = 0.7012y + 14.2483
Figures
 Figure 1. Part 1 graphs. The Glucose-limited condition was used.
 Figure 2. Part 2 graphs. The 12°C equation was used for the top row and the 30°C for the bottom row.
Presentation: File:Biomathmatical Modeling Final Presentation .pdf
Acknowledgments
I worked with my homework partner, Ava on this assignment. We texted throughout the week and met on Monday 5/7 and Wednesday 5/8 to discuss the assignment and make and practice our presentation.
Dr. Fitzpatrick also helped in class on 5/2 and in office hours on 5/8 with MATLAB and how to input our new variables and functions.
Except for what is noted above, this individual journal entry was completed by me and not copied from another source.
Angela C Abarquez (talk) 21:03, 7 May 2019 (PDT)
References
Loyola Marymount University (6 May 2019) BIOL388/S19:Week 14/15. Retrieved from https://openwetware.org/wiki/BIOL388/S19:Week_14/15 on 6 May 2019.
Quick Links
User Page: Angela Abarquez
Course Homepage:BIOL388/S19
Assignments:
Week 1: Instructions and Class Journal
Week 2: Instructions and Class Journal and Individual Journal
Week 3: Instructions and Class Journal and Individual Journal
Week 4/5: Instructions and Class Journal and Individual Journal
Week 6: Instructions and Class Journal and Individual Journal
Week 7/8: Instructions and Class Journal and Individual Journal
Week 9: Instructions and Class Journal and Individual Journal
Week 10: Instructions and Class Journal and Individual Journal
Week 11: Instructions and Class Journal and Individual Journal
Week 12: Instructions and Class Journal and Individual Journal
Week 14/15: Instructions and Individual Journal