Alison S King Week 12
Purpose
The purpose of this week's assignment is to better understand chemostats and create a model for a two-nutrient system in a chemostat. We will create this model in MATLAB through our understanding of differential equations. We also want to use our model to predict when the system reaches steady state and compare the results to those of the Tai et al. (2007) paper.
Workflow and Results
Answers from Literature
Reconsider Table 1 of the Tai et al (2007) journal club paper and do some research on chemostats.
- Find some reference material (books, papers, preferably not random internet sites) on chemostat growth processes, so that you can answer these questions.
- The yield quantity Y Glu/X: this is a ratio of what quantities? Be specific and relate to the 2-nutrient chemostat model from class.
- Y Glu/X is the ratio of biomass dry weight (grams) to grams of glucose. It is the growth-associated product. In our 2-nutrient chemostat, it shows how much glucose is consumed. It can also be used to determine our parameter E which equals 1/(Y Glu/X).
- The flux qGlu is a ratio of what quantities? Be specific and relate to the 2-nutrient chemostat model from class.
- The flux qGlu is the dilution rate, which is the ratio of mmol/gram of glucose being poured into the system over the unit of time 1 hour. In our model, we would use qGlu to determine how much glucose is being pumped into our system.
- Convert residual glucose and residual ammonia from mM to grams.
- Glucose 12:
- Residual glucose: .5044368 g
- Residual ammonia: 1.1104 g
- Glucose 30:
- Residual glucose: .05404 g
- Residual ammonia: 1.0440 g
- Ammonium 12:
- Residual glucose: 16.21404 g
- Residual ammonia: .0255465 g
- Ammonium 30:
- Residual glucose: 15.3312756 g
- Residual ammonia: .0034062 g
- Glucose 12:
- Determine the length of time the chemostat is operated before data is collected.
- Biomass dry weight, metabolites, dissolved oxygen, and gas profiles had to be constant for at least three volume changes before they sampled/collected data. Three volume changes would take 100 hours.
- Determine as many model parameters as you can from these data: use the "warm" data and both glucose- and ammonium-limited data.
- E = 14.2857
- u = 25 g/L (C-lim), 46 g/L (N-lim)
- q = 0.03 h^-1
- v = 5 g/L (C-lim), 0.65 g/L (N-lim)
- r, r is taken by setting dx/dt equal to zero and solving
- K, estimated K to be something between the u values of the C-lim and N-lim
- F, solve for F from the equation Fxq-qz+qv=0
- L, estimated L to be something between the v values of the C-lim and N-lim
- The yield quantity Y Glu/X: this is a ratio of what quantities? Be specific and relate to the 2-nutrient chemostat model from class.
2-nutrient Chemostat Model
Develop a simulation model for a 2-nutrient chemostat.
- Modify the MATLAB files chemostat_script.m and chemostat_dynamics.m to simulate a 2-nutrient chemostat. You will find those codes in the zipfile here. This task will require the equations we developed in class.
- Use what parameters you have determined from the data to simulate the system.
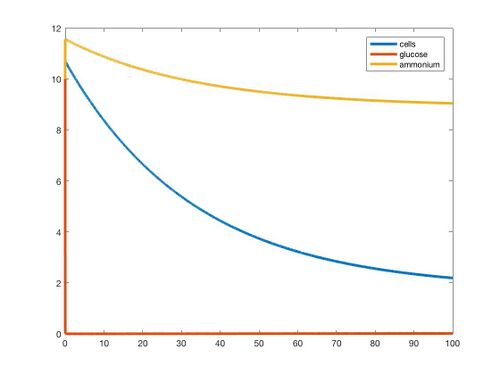
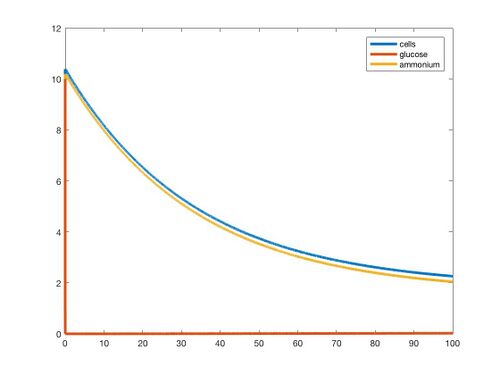
- Do the graphs show the system going to steady state?
- I'm not sure if the system is in steady state because some of the lines still seem to be sloping downwards at t=100 hours. However, I would say that if they are not in steady state, they are certainly approaching.
- Do the steady states match the Table 1?
- Be sure to save the graphs and upload them to your journal.
Scripts and Figures
Carbon limited environment at 30 deg C

Nitrogen limited environment at 30 deg C

Scientific Conclusion
Using computers to run models can be an effective way to simulate a real experiment. Drawing our parameters from the data in the Tai et al. (2007) paper, we were able to use MATLAB to simulate a chemostat experiment in which there were two nutrients involved, glucose and ammonium. By comparing the glucose limited and ammonium limited chemostat environments, we can see how limiting one nutrient affects the overall growth of the population of yeast. The models returned different behavior and eventually ended up with different steady states for each nutrient and the biomass. In the carbon (glucose) limited environment, ammonium is in abundance, but the yeast quickly consume most of the glucose as they approach equilibrium. In both models, the biomass seems to reach steady state at similar values, around 1.8, which we could deduce from the literature.
Acknowledgments
My homework partner, Angela, and I worked together on this assignment.
Except what is noted above, this individual journal entry was completed by me and not copied from another source.
Alison S King (talk) 19:52, 25 April 2019 (PDT)
References
Loyola Marymount University (23 April 2019) BIOL388/S19:Week 12. Retrieved from https://openwetware.org/wiki/BIOL388/S19:Week_12 on 23 April 2019.
Aucoin, M. G., McMurray-Beaulieu, V., Poulin, F., Boivin, E. B., Chen, J., Ardelean, F. M., … Jolicoeur, M. (2006). Identifying conditions for inducible protein production in E. coli: combining a fed-batch and multiple induction approach. Microbial cell factories, 5, 27. doi:10.1186/1475-2859-5-27
Links
Class Page: BIOL388/S19
Assignment Pages:
Shared Journals:
- Class Journal Week 1
- Class Journal Week 2
- Class Journal Week 3
- Class Journal Week 4
- Class Journal Week 5
- Class Journal Week 6
- Class Journal Week 7
- Class Journal Week 8
- Class Journal Week 9
- Class Journal Week 10
- Class Journal Week 11
- Class Journal Week 12
- Class Journal Week 14/15
Individual Journals: