Alison S King Week 2
Purpose
The purpose of this assignment is to learn about DNA microarray experiments, analyze problems about DNA microarrays, and read about as well as discuss a case in which ethical research standards were violated.
Answers to Questions
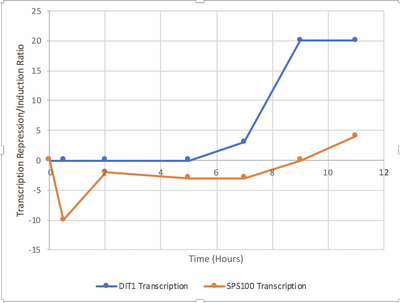
- Graph of Transcription from Figure 4.6b

- Color ratios for Figure 4.7b

- Gene X and Gene Y were transcribed similarly. Both achieved black at the 1 and 5 hour marks. However, the shades of red at 3 hours differed slightly, as did the shades of green at 9 hours. Gene Z differed significantly, starting black and continuing to be dim red for the rest of the time.
- Spots show up as yellow when that particular gene has not been strongly expressed or strongly repressed. A red dot means strong transcription, a green dot means strong repression, so a yellow dot is the middle ground. Most spots would probably be yellow at the first time point because not enough time has passed for the gene to have strongly reacted in either direction.
- Over the course of this experiment, TEF4 was repressed, as we can tell because it produced a green spot on OD 3.7. As a gene that is largely involved in translation, TEF4 would be repressed in the absence of ample glucose because the cell wouldn't be as concerned with protein production as much as creating energy.
- In the experimental group where glucose was being reduced, the yeast cells responded as if they could sense the depletion of glucose. These cells induced TCA cycle genes because this would lead to glycolysis and subsequently the production of glucose that could be converted into storage sugars.
- The genome could make sure that the genes in a common pathway are induced or repressed by the same transcription factor (i.e. guilt by association). This way, when the transcription factor is present, both genes will be expressed. Likewise, when the transcription factor is absent, both genes will be suppressed.
- TUP1 is responsible for the repression of glucose-repressed genes. If working with cells that have deleted TUP1, then glucose-repressed genes would be expressed even in the presence of glucose. It seems that in the later time points of the experiment, as the glucose levels dropped, the genes would still be expressed regardless of glucose level. This means that they would be red.
- Cells that overexpress the Yap1p transcription factor would be red at the later time points because there would have been lots of transcription occurring.
- To verify that you had truly deleted TUP1 or overexpressed Yap1p, you should check to see that most spots are either red or yellow. There should be few, if any, repressed (green) spots.
Acknowledgements
I worked with my partner, Desiree Gonzalez, on this week's assignment. We texted a couple of times during the week about certain questions that we could not figure out on our own.
Except for what is noted above, this individual journal entry was completed by me and not copied from another source.
Alison S King (talk) 18:05, 29 January 2019 (PST)
References
Campbell, A.M. & Heyer, L.J. (2003), “Chapter 4: Basic Research with DNA Microarrays”, in Discovering Genomics, Proteomics, and Bioinformatics, Cold Spring Harbor, NY: Cold Spring Harbor Laboratory Press, pp. 107-124.
Davidson College Department of Biology (2001) DNA Microarray Methodology - Flash Animation. Retrieved from http://www.bio.davidson.edu/courses/genomics/chip/chip.html on 29 January 2019.
Links
Class Page: BIOL388/S19
Assignment Pages:
Shared Journals:
- Class Journal Week 1
- Class Journal Week 2
- Class Journal Week 3
- Class Journal Week 4
- Class Journal Week 5
- Class Journal Week 6
- Class Journal Week 7
- Class Journal Week 8
- Class Journal Week 9
- Class Journal Week 10
- Class Journal Week 11
- Class Journal Week 12
- Class Journal Week 14/15
Individual Journals: