Aiden Burnett Week 2
Purpose
To explore the factors that influence the results of a SIR pandemic disease model and apply them to the real-world COVID-19 pandemic.
Methods & Results
- Watched the video: The role of applied math in real-time pandemic response: How basic disease models work
- Recorded two questions that I had after watching the video.
- Is it possible to communicate the math behind the SIR model in an effort to educate "anti-maskers", or would that require that America's scientific literacy (& hostility) problem be addressed first.
- What sort of immunity do Covid-19 survivors have when they move from "infectious" to "recovered"
- Recorded two questions that I had after watching the video.
- Read the information on this website.
- Looked at the graphs and assessed my understanding by answering the questions:
- What happens if initial I = 0?
- No outbreak would take place.
- What does it mean that red line increases so rapidly?
- The disease in question is highly contagious.
- What does it mean that green line also rises rapidly, but not as rapidly?
- the R2 (recovery rate) for this disease is slower than it's R1 (infection rate).
- What does it mean that the green line reaches nearly to 1,000?
- Everyone in the simulation became infected but not all survived. The difference between the total number of people (1000) & the maximum number of people in the green line (980) is the number of people who died from the disease (20).
- What happens if initial I = 0?
- Looked at the graphs and assessed my understanding by answering the questions:
- I then explored an online, interactive SIR model, Epidemix.
- I went to the website and clicked the "Start" button in the middle of the page.
- I Selected the type of model I would explore (deterministic heterogeneous COMP) from the drop-down menu on the upper-left side of the page.
- I chose to use a deterministic, rather than stochastic, model so that I could be sure that the differences in my graphs were the result of my inputs, and not randomness.
- I chose to use a compartmental, rather than individual based model, to make the graphs easier to quickly compare (as the lines are less frantic).
- I chose to use homogeneous, as opposed to heterogeneous, mixing so that the model would only create 1 graph per set of input. This was in the interest of simplifying comparison between inputs
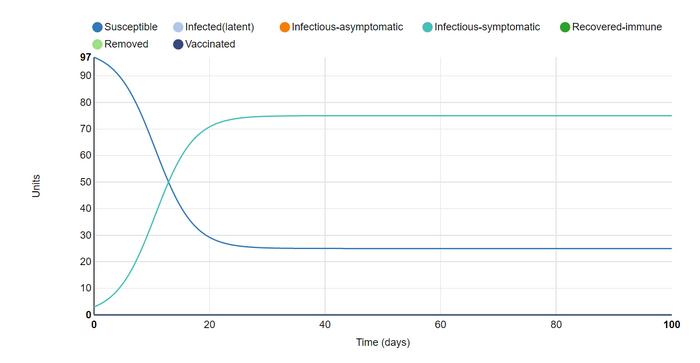
This is a screenshot I took of the initial plot that was shown on the page.
- The graph has the default parameters of:
- Infection states to consider: susceptible & infectious-symptomatic.
- A closed host population of 100 units.
- Infection and Transmission inputs
- Number of infected units at the start of the simulation = 1
- Daily number of effective contacts per unit = 0.4
- Length of symptomatic infectious period = 10 days
- Frequency-dependent transmission
- No outbreak control strategy
- Simulation length of 100 days
I then explored the model by changing various parameters and seeing what happened to the graph.
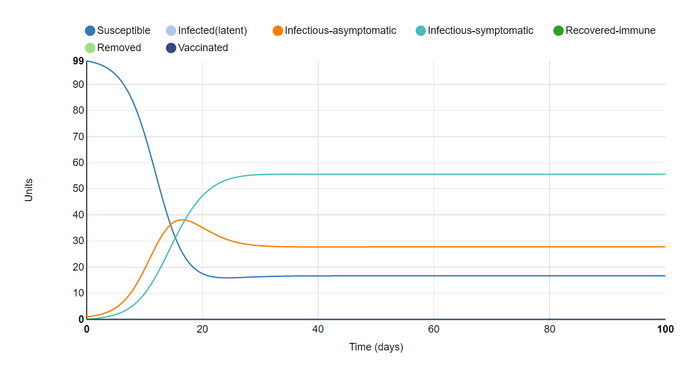
I First changed the parameters by adding infectious-asymptomatic as an infection state to consider. This was in order to simulate an outbreak more similar to the Covid-19 pandemic. The most immediate effect this has on the graph is the addition of an orange line to indicate the new group, as well the the lowering of the other two lines. This is most likely because
- infected units now have another category to fall into, lowering the total number of infectious-symptomatic units
- and asymptomatic infectious units are more likely to infect others by not needing to rest or isolate, lowering the number of susceptible units.
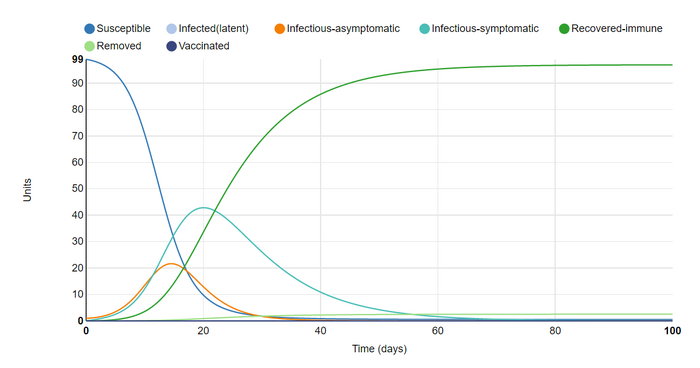
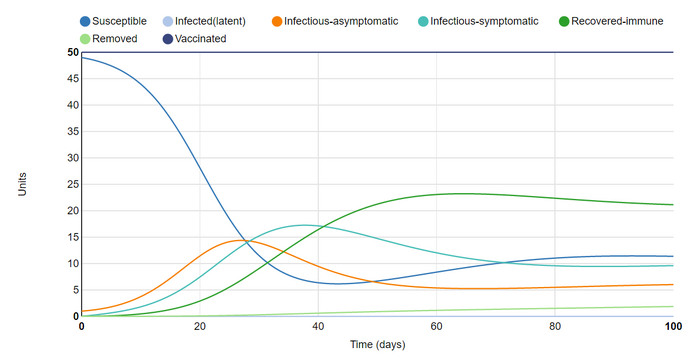
Next I added recovered-immune as an infection state. I set the removal (death) rate for infected units to 2.55%, so as to mirror the Covid-19 death rate in my home state of Arizona as of 9/14/2020 (AZDHS 2020). For this reason I also set the length of the asymptomatic infectious period to 3 days, and the symptomatic infectious period to 14 days (Harvard 2020). This changed the graph by adding a line for recovered-immune & removed from simulation (deceased). The fact that all recovered units were set to remain immune until removed from the simulation caused the outbreak to quickly resolve, which 95/100 units recovered-immune by day 60.
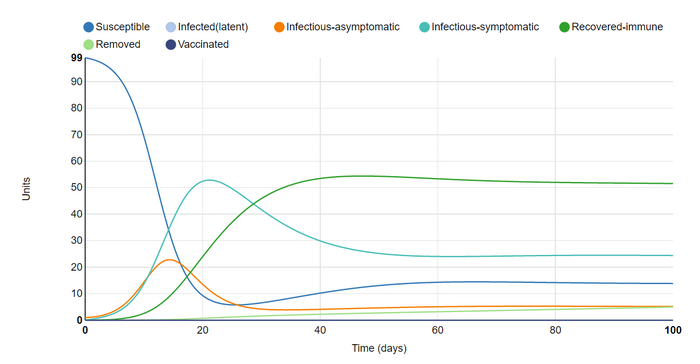
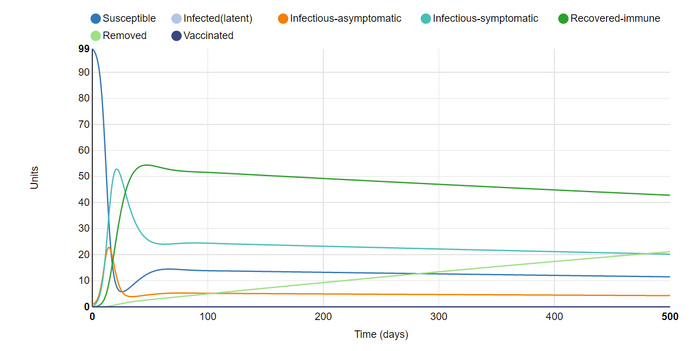
In this graph I set recovered units to remain immune for 30 days. This prevented the outbreak from resolving but did cause it to reach a sort of equilibrium as it did in the initial and first graphs. The steadily rising removed group led me to my next adjustment
In this graph I set the simulation to last 500 days (it's maximum duration). This confirmed my suspicion that allowing the last attempt to last longer would result in a steadily increasing number of deaths, subtracting from the recovered population, which in turn allows less units to become susceptible again and steadily lowers all lines. While I would have preferred to keep the simulation length at 500 days, the toll on my laptop made doing so unfeasible. This led me to toggle another parameter that I expected to ramp up the strain on my laptop.
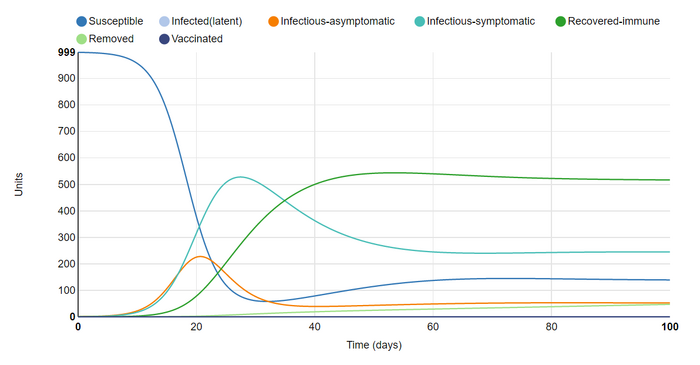
For this graph I changed duration back to 100 days and increased population size from 100 to 1000. As expected this did not change the graph much beyond increasing the numbers on the y-axis. I reduced the population to, again, reduce strain on my laptop.
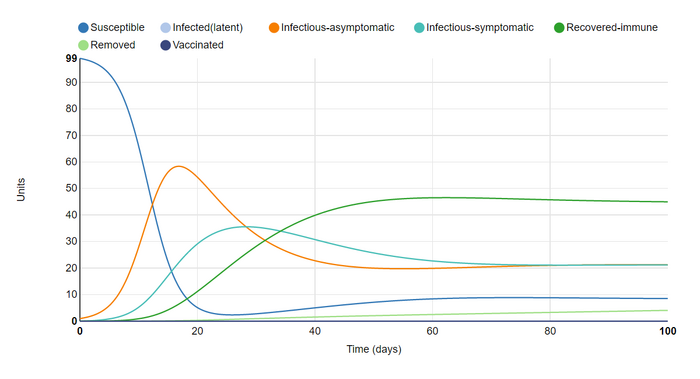
For my sixth graph I reduced the population to 100 & increased the length of asymptomatic infection from 3 to 14 day. This is because the current consensus on the infection caused by SARS-CoV-2 is that the period between exposure and symptom expression is between 3 & 14 days (Harvard 2020). I am of course ignoring the fact that on only becomes infectious after a day or two, but this is in order to keep the model from becoming crowded (by incorporating another infectious state)
This change caused the infectious-asymptomatic group to rise, lowering the infectious-symptomatic group, but increasing the total length of time that units are infected. This all lowered the number of susceptible and recovered units. Among other things, I assume that increasing the asymptomatic time raised the disease's R1, or rate of infection.
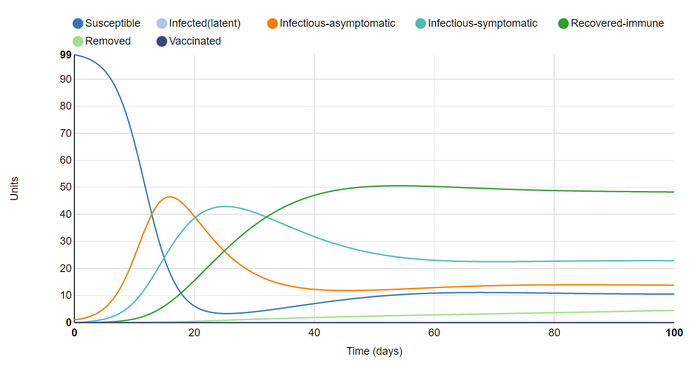
I set the asymptomatic length to 8.5 (between 3 & 14). This was to better represent the time-frame for asymptomatic-infectious individuals infected with covid-19 (who will eventually develop symptoms). This had the expected outcomes of looking to be in the middle of the two extremes for this parameter.
For this graph I vaccinated 50% of the population. This resulted in a line for the vaccinated group which remains at a constant 50 throughout the simulation. Interestingly, comparing the infectious lines between graphs 7 & 8 showed that vaccination "flattened the curve" in a similar way to social distancing & hand washing. I suppose that this is to be expected as all of these are methods of limiting infection, or slowing Rate 1.
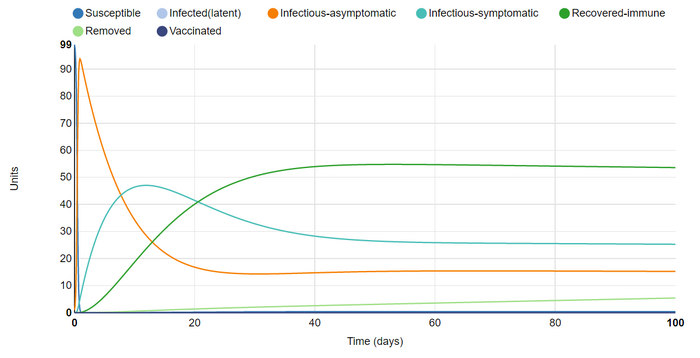
I then removed the vaccinations & tried to think about how I could infect as many units at once as possible. My first thought was to increase the number of effective contacts per unit (from 0.4 to 10). This definitely achieved my goal, with near 100% infection on day 1 (93 asymptomatic and 6 symptomatic). Interestingly, I found that the model did not assign a category to the 100th unit. I assume this is because there was some percentage of a unit in varying categories and the model is prevented from rounding any of these up. By infecting all units immediatly, I could clearly see as they moved between the stages of asymptomatic, symptomatic, and recovered. Also, I noticed that the model still reaches an equilibrium despite the fact that there are no susceptible units after day 1. Instead units are moved immediately from immune to infected.
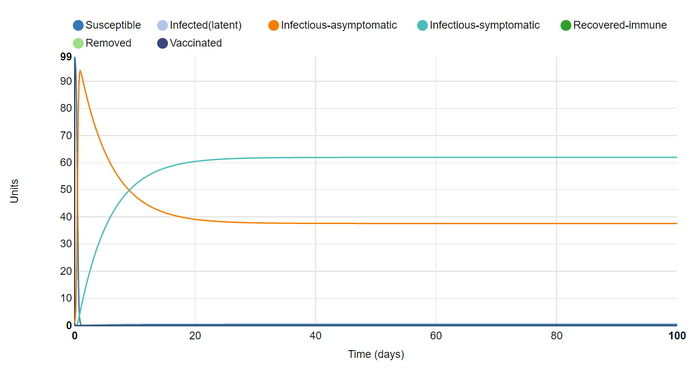
For my final graph kept the number of effective contacts but removed the recovered infection state. This also meant that the disease had no removal (mortality) rate. This graph surprised me because for some reason I expected the disease to die out. It is interesting to think of situations in which an entire population can live infected with a highly contagious but ultimately harmless disease, as I imagined the one in this graph to be.
Next I looked at Figure 1 of the Giordano et al. (2020) article and answered the following Questions.
- How did the authors modify the simple SIR model to take into account features of the COVID-19 pandemic?
- The Authors of this paper modified the SIR model by accounting for several more infection states. The expanded the simple Susceptible-Infectious-Recovered, to include diagnosed, recognized, ailing, threatened, and extinct.
- What public health policy implications does their model have?
- Their additions will provide policy makers with a much more comprehensive model, equipping them with the knowledge necessary to respond to the Covid-19 pandemic specifically, as opposed to any generic outbreak. By creating a bespoke SIR model for Covid-19, we can respond with more sensible policies.
- How did the authors modify the simple SIR model to take into account features of the COVID-19 pandemic?
Lastly, I checked my understanding my viewing [this comic]. This comic is funny because it acknowledges the fact that a model's accuracy is limited by the perspective and knowledge of the people who devised it.
Scientific Conclusion
The purpose of this exercise was to gain an understanding real-time pandemic disease modeling and the real world applicability of bioinformatics. I would say that this was accomplished. I understand how seemingly small pieces of information about a disease can be incorporated into SIR models and have great effect. I also see how SIR models can be used to inform policy makers, and average citizens, of the appropriate responses to an outbreak. For example, I learned that vaccination and social distancing/mask wearing all accomplish the same goal (lowering a disease's R1 or infection rate). This supports the idea that social distancing measures are our best tool to keep communities safe while waiting for a vaccine. I also learned that it is possible for a disease to become a normal part of life, reaching an equilibrium of susceptible, infected, and recovered. This is in contrast to the dominant expectation that outbreaks must eventually end.
Acknowledgments
- I was partnered with Fatimah Alghanem but we did not work together outside of discussing the assignment in class.
- I consulted the Help:Images page to learn how to size my graphs appropriately on the page.
- I explored the SIR model and generated graphs using the Epidemix website.
- I copied and modified procedures from the week 2 assignment page
- My purpose was revised following advice from Dr. Dahlquist.
- Except for what is noted above, this individual journal entry was completed by me and not copied from another source.
Aiden Burnett (talk) 22:07, 16 September 2020 (PDT)
References
OpenWetWare. (2020). BIOL368/F20:Week 2. Retrieved 14 September 2020, from https://openwetware.org/wiki/BIOL368/F
Youtube. 2020. The Role Of Applied Math In Real-Time Pandemic Response: How Basic Disease Models Work [Video]. Retrieved 14 September 2020, from https://www.youtube.com/watch?v=Ewuo_2pzNNw&feature=youtu.be&ab_channel=NIMBioS
AZDHS: COVID-19 Dashboards. (2020, September 14). Retrieved September 14, 2020, from https://www.azdhs.gov/preparedness/epidemiology-disease-control/infectious-disease-epidemiology/covid-19/dashboards/
Harvard Publishing. (2020, September 11). If you've been exposed to the coronavirus. Retrieved September 14, 2020, from https://www.health.harvard.edu/diseases-and-conditions/if-youve-been-exposed-to-the-coronavirus
Epidemix. (2020). Retrieved 14 September 2020, from https://www.epidemix.app/#
Help:Images - MediaWiki. (2020). Retrieved September 14, 2020, from https://www.mediawiki.org/wiki/Help:Images#Syntax
Giordano, G., Blanchini, F., Bruno, R., Colaneri, P., Di Filippo, A., Di Matteo, A., & Colaneri, M. (2020). Modelling the COVID-19 epidemic and implementation of population-wide interventions in Italy. Nature Medicine, 26(6), 855-860. doi: 10.1038/s41591-020-0883-7
University COVID Model. (2020). Retrieved 16 September 2020, from https://xkcd.com/2355/
Epstein, J., 2008. Why Model?. [online] Jasss.soc.surrey.ac.uk. Retreived September 16, 2020, from http://jasss.soc.surrey.ac.uk/11/4/12.html.bak
User Page
Template
Course Homepage
Weekly Assignments
- Week 1 Assignment
- Week 2 Assignment
- Week 3 Assignment
- Week 4 Assignment
- Week 5 Assignment
- Week 6 Assignment
- Week 7 Assignment
- Week 8 Assignment
- Week 9 Assignment
- Week 10 Assignment
- Week 11 Assignment
- Week 12 Assignment
- Week 14 Assignment
Individual Journal Pages
- Aiden Burnett
- Aiden Burnett Week 2
- Aiden Burnett Week 3
- Aiden Burnett Week 4
- Aiden Burnett Week 5
- Aiden Burnett Week 6
- Aiden Burnett Week 7
- FoldamerDB Review
- Aiden Burnett Week 9
- Aiden Burnett Week 10
- Aiden Burnett Week 11
- Aiden Burnett Week 12
- Aiden Burnett Week 14
