Aiden Burnett Week 5
From OpenWetWare
Jump to navigationJump to search
Purpose
To visualize and manipulate protein structures, and use this information to replicate selected figures from Wan et al. (2020) and refine my research project.
Methods & Results
Exploring the Spike protein Structure
- I began by exploring what was already known about the spike protein in the UniProt Knowledgebase (UniProt KB).
- I searched using the keyword "SARS-CoV-2" in the main UniProt search field. This yielded 1,616 results. Most of these results were viral proteins but some were from organisms such as mice and human.
- I then looked up the entry with accession number "P0DTC2" which corresponded to the reference entry for the SARS-CoV-2 spike protein.
- The database entry for this protein provided information in the following categories:
- function
- names & taxonomy
- subcellular location
- pathology & biotech
- PTM/processing
- interaction
- structure
- family & domains
- sequence
- similar proteins
- cross-references
- entry information
- miscellaneous.
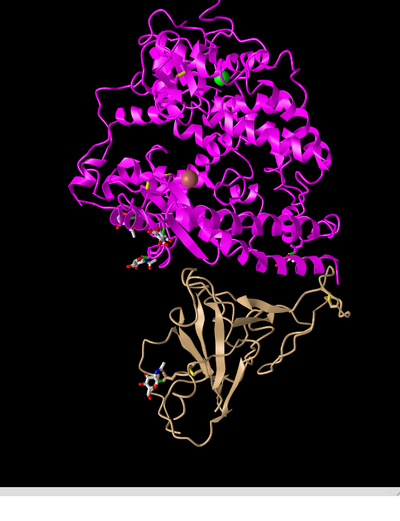
- Next, I viewed the structure shown in figure 1A from Wan et al.(2020) in the NCBI Structure Database using the web-based iCn3D viewer. Figure 1A (2AJF) depicts SARS-CoV RBD (year 2002) complexed with human ACE2.
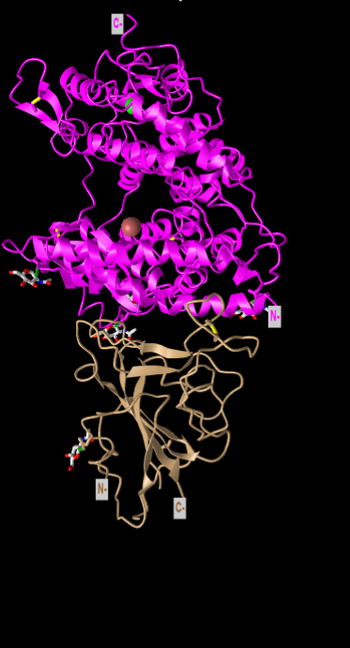
- In the above image I manipulated the structure in the iCn3d viewer to recreate Figure 2A from the Wan et al. (2020) paper.
- Is this a primary, secondary, tertiary, or quaternary structure? Explain your reasoning.
- This is a depiction of a quaternary structure as 2 polypeptide chains are present, these being depicted in magenta (ACE2 protein) and tan (spike protein).
- How many domains are in this structure? Explain your reasoning.
- There are two domains present, these being the spike protein and the ACE2 protein. These are each a single domain as they cannot be cut in any place while producing 2 independently folding domains (scissors and hula hoop test).
- Is this a primary, secondary, tertiary, or quaternary structure? Explain your reasoning.
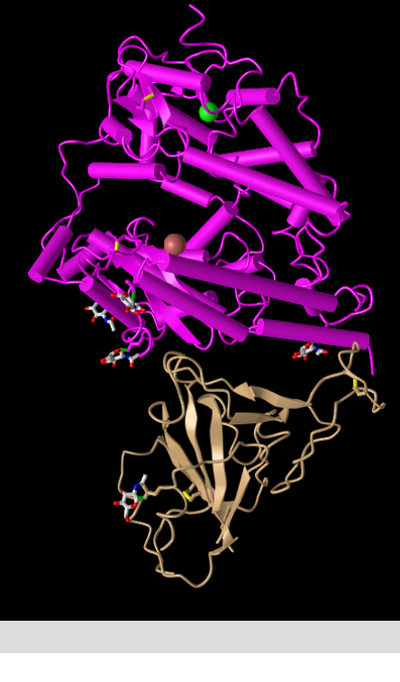
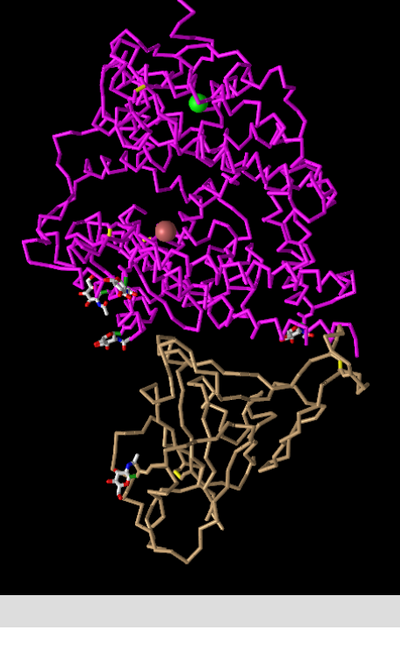
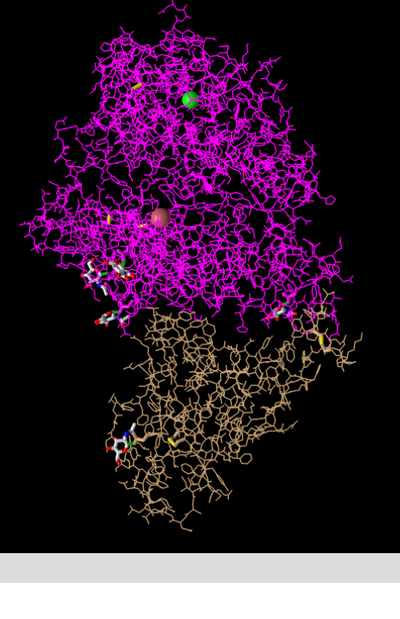
- Next I clicked on the Style > Proteins menu and produced the following screenshots of the same structure in various styles:
Cylinder and Plate
- This style depicts the alpha helices as cylinders and the beta sheets as plates, making it useful for viewing and the communicating the protein's secondary structures.
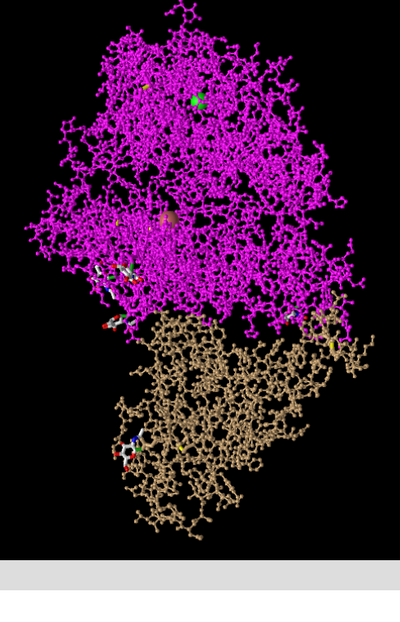
C Alpha Trace
- This style simplifies the structure by depicting only the backbone of the polypeptide chain(s). Each alpha carbon is represented as a kink in the structure. Side chains are omitted.
Lines
- This style shows the backbone and all side chains as lines. This allows the viewer to discern the orientation of side chains and the backbone, but is perhaps too messy to be useful for displaying larger scale information.
Ball and Stick
- This style depicts all atoms as balls and all bonds as sticks. This is comparable to the lines model, which only displays bonds, but in my opinion is more digestible on a larger scale.
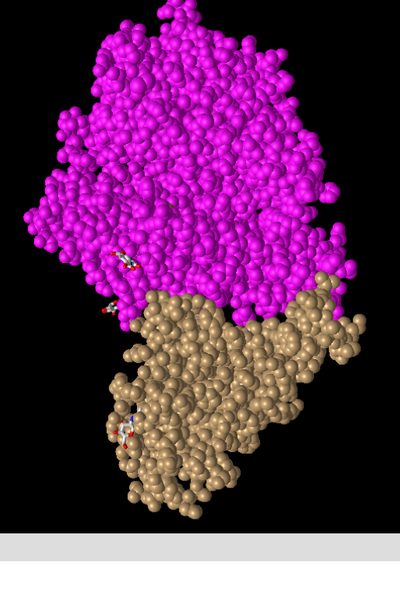
Spheres
- This style resembles the space filling model of smaller structures in that it attempts to accurately depict the space taken up by each atom. This can be useful when trying to visualize the 3d structure of a protein.
In the “Spheres” view, I clicked on the Color menu and produced screenshots of the following colour schemes:
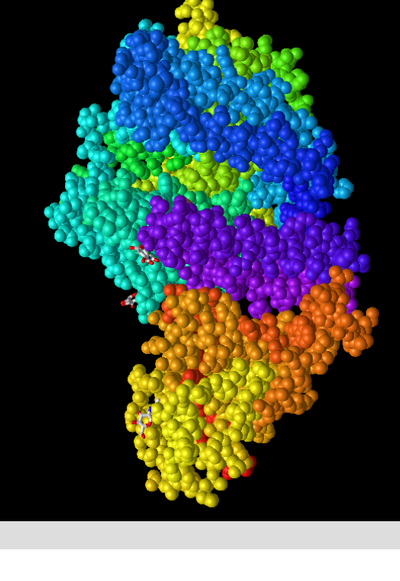
Spheres: Spectrum
- I could tell that this colour scheme divided different segments of the structure into groups, thought I could not discern how these were determined. I consulted the "ICn3D Help Document" produced by NCBI which stated that version 2.10.0 allowed users to "Display/output salt bridges; color helices and sheets with spectrum in the menu 'Color > Secondary > Spectrum'." (NCBI 2020) from this I assume that the different regions are displaying areas of naturally different solute concentration/attractiveness, although I am not confident that this is the most likely explanation.
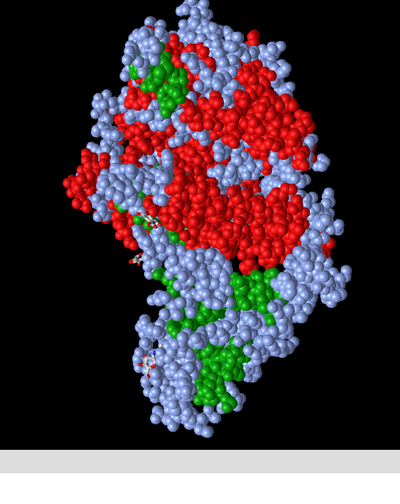
Spheres: Secondary
- This colour scheme depicts the atoms involved in secondary structures as red (alpha helix) or green (beta sheet). Atoms not involved in a secondary structure are depicted as steel blue, rather than omitted. This allows the viewer to place the secondary structures within the larger context of the molecule. I should not that I am unsure of whether each sphere represents an atom or an amino acid, but I am assuming atom based on the fact that the C alpha trace style depicted individual carbon atoms.
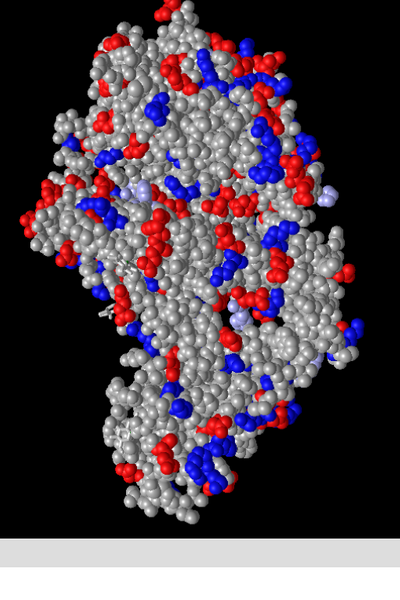
Spheres: Charge
- This colour scheme depicts positively charged (basic) amino acids in blue, negatively charged (acidic) amino acids in red, and all other atoms in gray. Curiously some atoms are seen with a steel blue colour. The help document did not contain any information about what this is meant to represent. My best guess is that they are slightly positive/basic. This is supported by the fact that the steel blue amino acids are all Histidine, which can have a positive or neutral charge on its side chain.
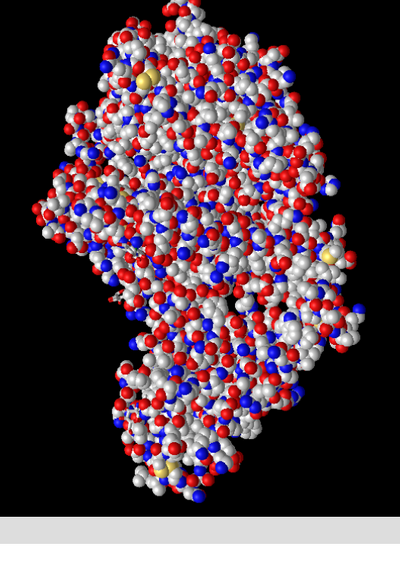
Spheres: Atom
- This colour scheme depicts atoms in colours corresponding to their varying elements, as follows:
- carbons-grey
- oxygens-red
- nitrogen-blue
- sulfur-yellow
- It should be noted that this is following the CPK colouring convention
N-terminus and C-terminus
- The N & C termini are labelled on the image above.
Secondary structures
- The secondary structures of the ACE2 protein are all alpha helixes. This was found by looking at the magenta portion of cylinder and plate style model above.
- The secondary structures of the spike protein are all beta pleated sheets. This was found by looking at the tan portion of the cylinder and plate style model.
Side-Chain interactions
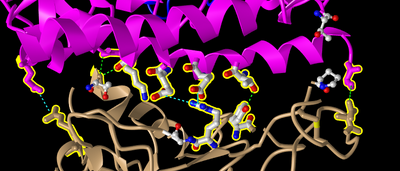
- Next I looked at side chain-side chain interactions in the civet ACE2-spike protein structure shown in Figure 4B of the Wan et al. paper. To do this I:
- Clicked on the above link to interact with the structure in iCn3D
- Clicked on the Analysis menu to “View Sequences & Annotations”
- In the new window that appeared to the right, I clicked on the “Details” tab to show the actual amino acid sequences
- There were 2 sets of ACE2-spike proteins because of the way the proteins crystallized.
- Focused on the pink and tan chains and oriented them like is shown in Figure 4B
- Next I endeavored to make the amino acid side chains shown in the figure visible.
- In the sequence window I went to sequence “Protein 3SCK_A” (in pink) and selected the following amino acids
- T31
- E35
- E38
- T82
- K353
- Went to the Styles menu and selected Proteins > Ball and Stick
- Went to the Color menu and selected Atom
- This allowed me to see the side chains as shown in the figure.
- Repeated this process for the tan spike protein sequence 3SCK_E for the following amino acids:
- T487
- R479
- G480
- Y442
- P472
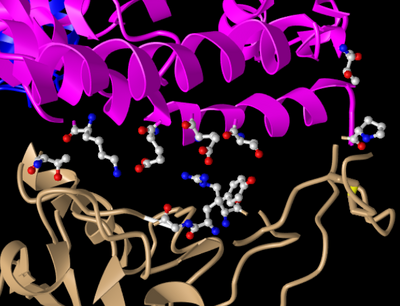
- I then took the following screenshot, oriented like Figure 4B of Wan et al. (2020)
- E35 on ACE2 makes an ionic bond with R479 on spike protein. Which of these is acidic and which is basic? How can you tell that from the image you created?
- I know that E35 is acidic and R479 is basic because they are glutamic acid and arginine respectively. I could have gathered this from the image by noting that E35 has an oxygen and R479 has a nitrogen. This would mean that in an ionic bond of the two, E35's Oxygen would likely protonate R479's nitrogen.
- T31 on ACE2 makes a hydrogen bond with Y442 on spike protein. Which side chain classification do these two amino acids belong to (acidic, basic, uncharged polar, nonpolar)? How can you tell that from the image you created?
- These side chains are Threonine and Tyrosine respectively. I can tell that these side chains are uncharged polar because they contain hydroxyl (OH) groups.
- I made dashed lines for these bonds in iCn3D as follows:
- I went to the Analysis menu and select H bonds & Interactions
- In part 1 of the window that appeared, I unchecked “Contacts/Interactions” leaving Hydrogen Bonds and Ionic Interaction checked
- In part 2 of the window, I selected the first set “3SCK_A” (pink)
- In part 3 of the window, I selected the second set “3SCK_E” (tan)
- In part 4 of the window, I clicked the button “3D Display”
- I then saw the dashed lines representing the ionic bonds and H-bonds between the two polypeptide chains and amino acids described above.
Beginning your research project
- Consulting with your partner, answer the following:
- What question will you answer about sequence-->structure-->function relationships in the spike and/or ACE2 protein?
- Does comparing sequences of possible animal reservoirs noted by Wan et al point towards one or more animal reservoirs as being closely related to humans, and therefore make them a good starting point for looking at SARS-CoV-2 lineage?
- What sequences will you use?
- We would use the ACE2 host receptor sequences for humans, bats, civets, mice, rats, pigs, ferrets, cats, orangutans, pangolins (potential intermediary host), dromedary camels, squirrels, mink, turtles, snakes, chickens, fox, and monkeys. This would hopefully result in finding ACE2 receptors most similar to humans, and lend itself to a direction for future research (i.e. looking at coronaviruses which infect these animal reservoirs & comparing them to SARS-CoV-2).
- What question will you answer about sequence-->structure-->function relationships in the spike and/or ACE2 protein?
Scientific Conclusion
Protein structures can be visualized in a myriad of ways, which alters the information which can be gained from the model. This means that I will need to be thoughtful of any visuals used in my research project, both in terms of gaining information and communicating findings.
Acknowledgments
- I consulted with my partner Anna Horvath during class and over text to troubleshoot minor technical issues, as well as brainstorm our research project.
- I copied and modified procedures from the week 5 assignment page.
- Except for what is noted above, this individual journal entry was completed by me and not copied from another source.
Aiden Burnett (talk) 22:14, 7 October 2020 (PDT)
References
- UniProt ConsortiumEuropean Bioinformatics InstituteProtein Information ResourceSIB Swiss Institute of Bioinformatics. (2020, August 12). Spike glycoprotein. Retrieved October 07, 2020, from https://www.uniprot.org/uniprot/P0DTC2
- Wan, Y., Shang, J., Graham, R., Baric, R. S., & Li, F. (2020). Receptor recognition by the novel coronavirus from Wuhan: an analysis based on decade-long structural studies of SARS coronavirus. Journal of virology, 94(7). DOI: 10.1128/JVI.00127-20
- OpenWetWare. (2020). BIOL368/F20:Week 5. Retrieved October 5, 2020, from https://openwetware.org/wiki/BIOL368/F20:Week_5
- ICn3D: Web-based 3D Structure Viewer. (n.d.). Retrieved October 07, 2020, from https://www.ncbi.nlm.nih.gov/Structure/icn3d/full.html
- ICn3D Help Document. (2020, April 21). Retrieved October 07, 2020, from https://www.ncbi.nlm.nih.gov/Structure/icn3d/docs/icn3d_help.html
- ICn3D: Web-based 3D Structure Viewer. (n.d.). Retrieved October 07, 2020, from https://www.ncbi.nlm.nih.gov/Structure/icn3d/full.html?pdbid=+3SCK
User Page
Template
Course Homepage
Weekly Assignments
- Week 1 Assignment
- Week 2 Assignment
- Week 3 Assignment
- Week 4 Assignment
- Week 5 Assignment
- Week 6 Assignment
- Week 7 Assignment
- Week 8 Assignment
- Week 9 Assignment
- Week 10 Assignment
- Week 11 Assignment
- Week 12 Assignment
- Week 14 Assignment
Individual Journal Pages
- Aiden Burnett
- Aiden Burnett Week 2
- Aiden Burnett Week 3
- Aiden Burnett Week 4
- Aiden Burnett Week 5
- Aiden Burnett Week 6
- Aiden Burnett Week 7
- FoldamerDB Review
- Aiden Burnett Week 9
- Aiden Burnett Week 10
- Aiden Burnett Week 11
- Aiden Burnett Week 12
- Aiden Burnett Week 14
