Taylor Makela Journal Week 2
From OpenWetWare
Jump to navigationJump to search
Taylor Makela Week 2
Purpose
- The purpose of this assignment was to gain experience analyzing SIR models as well as looking at how this model can be altered to better fit the COVID-19 pandemic. Various changes to the parameters of the SIR model were made in order to observe how changing individual properties affects the rate at which the number of susceptible, infected, and recovered people changes.
Methods/Results
Methods
- Watched the video: "The Role of Applied Math in Real-Time Pandemic Response: How Basic Disease Models Work" and recorded two questions.
- Read this page on the Epidem-Sim website and answered the following four questions:
- What happens if initial I = 0?
- What does it mean that red line increases so rapidly?
- What does it mean that green line also rises rapidly, but not as rapidly?
- What does it mean that the green line reaches nearly to 1,000?
- Explored the "Deterministic Homogeneous COMP" model on the Epidemix site
- Went to the Epidemix site and clicked the "Start" button in the middle of the page
- Selected the "Deterministic Homogeneous COMP" model and explained why I selected this model
- Took a screenshot of the initial plot shown on the page
- Made the following 10 parameter changes:
- Changed the population size from 100 to 1000
- Changed the number of infected units at start of simulation from 1 to 2
- Changed the daily number of effective contacts per unit from 0.4 to 0.7
- Changed length of symptomatic infectious period from 10 days to 5 days
- Changed the daily number of effective contacts per unit from 0.4 to 0.2
- Changed the number of infected units at start of simulation from 1 to 10
- Changed length of symptomatic infectious period from 10 days to 15 days
- Changed the control strategy from none to vaccination (proportion of vaccinated units = 0.5)
- Changed the length of the simulation from 100 days to 150 days
- Changed the control strategy from none to culling (reduced length of symptomatic infection period = 5)
- Looked at Figure 1 and answered the following questions:
- How did the authors modify the simple SIR model to take into account features of the COVID-19 pandemic?
- What public health policy implications foes their model have?
- Looked at this comic and answered the following question:
- Why is this comic funny?
- Wrote my scientific conclusion
Results
Questions About the Video: "The Role of Applied Math in Real-Time Pandemic Response: How Basic Disease Models Work"
- How would rates 1 and 2 change if 75% of susceptible and infected people filled stay at home orders?
- What is the R₀ value for COVID-19?
Pandem-Sim Questions
- If the initial I value = 0, that means that when the Days Since Onset = 1, the Number of People infected = 0. This means that there is no one infected and therefore the disease cannot spread.
- The red line (the number of infected people) increases rapidly because the disease being modeled is clearly very contagious. At the beginning of the outbreak, there were a lot of susceptible people so these people very quickly became infected, but by day 26, most susceptible people had already been infected, thus explaining why the curve then goes down.
- The green line (the number of recovered people) also increases, but not as rapidly as the red line. This is because the green line represents the number of people that have recovered from the disease, meaning that people are recovering slower than they are being infected (red line). However, after around 101 days, the green line begins to straighten out because there are very few infected people left to recover.
- Since the green line reaches nearly 1000, that means that almost every person in the study (a total of 1000) recovered from the disease and very few people died from the disease.
Epidemix
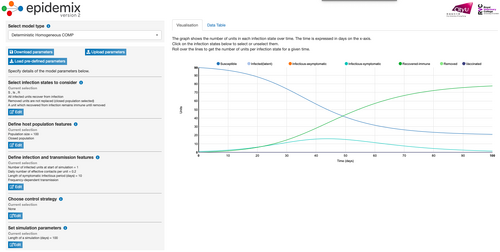
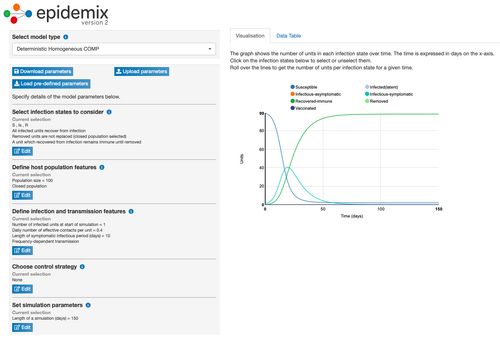
Initial Model: Deterministic Homogeneous COMP
- I chose the Deterministic Homogeneous COMP model because I wanted to choose a homogeneous model because I wanted to be able to focus on one SIR model instead of two (the heterogeneous models).
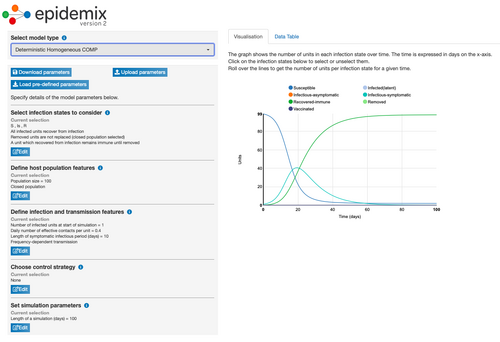
- The graph shows that at 20.4 days, the turquoise line (the number of infectious-symptomatic people) begins to go down because after around 40% of the population became infectious-symptomatic (at 20.4 days), the rate of recovery began to increase rapidly (the green line) and thus the number of susceptible people (the blue line) also decreased.

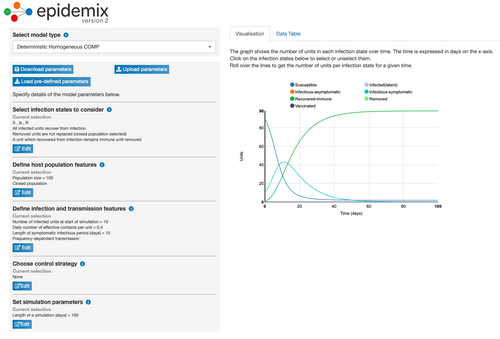
Model Parameter Change 1: Changed Population from 100 to 1000
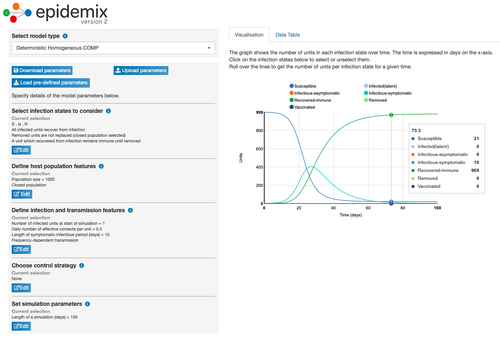
- Increasing the population also increased the length of time it took for the turquoise line to decrease (i.e. for the number of infectious-symptomatic people to decrease and the number of recovered people (green line) to increase).

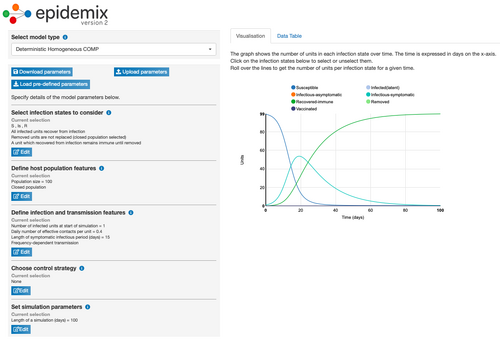
Model Parameter Change 2: Changed Number of Infected Units at Start of Simulation
- Changing the number of infected people at the start of the simulation from 1 to 2 surprisingly decreased the number of days it took for the turquoise line to begin to decrease. With these parameters, it took approximately 17 days for the number of infectious-symptomatic people (turquoise line) to decrease and for the number of recovered people (green line) to increase.

Model Parameter Change 3: Changed Number of Effective Contacts Per Unit

- Changing the number of effective contacts per person from 0.4 to 0.7 also decreased the number of days it took for the turquoise line to begin to decrease compared to the initial parameters. Under these conditions, it took 12.1 days for the number of infectious-symptomatic people (turquoise line) to begin to decrease and for the number of recovered people (green line) to increase.

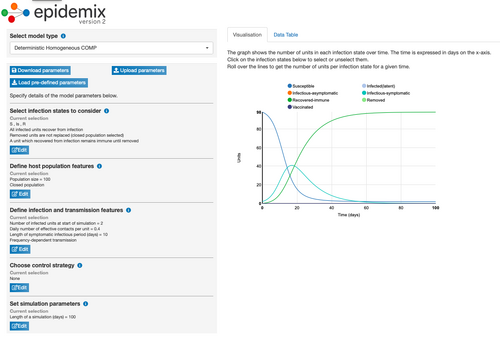
Model Parameter Change 4: Changed Length of Symptomatic Infectious Period
- Changing the length of symptomatic infectious period from 10 days to 5 days increased the number of days it took for the turquoise line to begin to decrease. Under these conditions, it took 23.9 days for the number of infectious-symptomatic people (turquoise line) to begin to decrease and for the number of recovered people (green line) to increase. This parameter change lead to the first graph where the number of susceptible people (blue line) did not level out at zero.

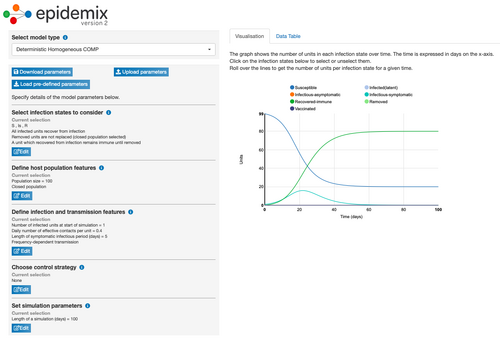
Model Parameter Change 5: Changed Number of Effective Contacts Per Unit
- Changing the Daily number of effective contacts person from 0.4 to 0.2 more than doubled the number of days it took for the turquoise line to begin to decrease. Under these conditions, it took 47.6 days for the number of infectious-symptomatic people (turquoise line) to begin to decrease and for the number of recovered people (green line) to increase. This parameter change also lead to the blue line (number of susceptible people) never reaching zero.

Model Parameter Change 6: Changed Number of Infected Units at Start of Simulation
- Changing the number of infected people at the start of the simulation from 1 to 10 decreased the number of days it took for the turquoise line to begin to decrease. Under these conditions, it took 12.3 days for the number of infectious-symptomatic people (turquoise line) to begin to decrease and for the number of recovered people (green line) to increase. This means that it took 5 days less for the turquoise line to decrease when the number of infected units at the start was changed to 10 people compared to when it was changed to 2 people.

Model Parameter Change 7: Changed Length of Symptomatic Infectious Period
- Changing the length of symptomatic infectious period from 10 days to 15 days slightly decreased the number of days it took for the turquoise line to begin to decrease compared to the original parameters. Under these conditions, it took 19.8 days for the number of infectious-symptomatic people (turquoise line) to begin to decrease and for the number of recovered people (green line) to increase.

Model Parameter Change 8: Changing the Control Strategy
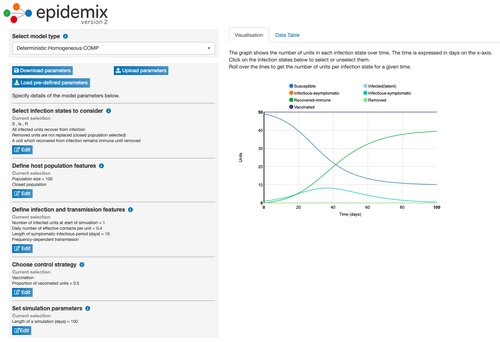
- Changing the control strategy from none to vaccination (proportion of vaccinated units = 0.5) increase the number of days it took for the turquoise line to begin to decrease. Under these conditions, it took 44.5 days for the number of infectious-symptomatic people (turquoise line) to begin to decrease and for the number of recovered people (green line) to increase.

Model Parameter Change 9: Changing Length of Simulation
- Changing the length of the simulation from 100 days to 150 days did not have a large impact on the number of days it took for the turquoise line to begin to decrease compared to the initial conditions. Under these conditions, it took 20 days for the number of infectious-symptomatic people (turquoise line) to begin to decrease and for the number of recovered people (green line) to increase. In comparison, it took 20.4 days under the initial conditions.

Model Parameter Change 10: Changing the Control Strategy
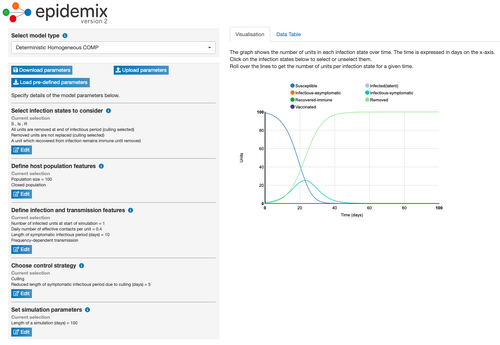
- Changing the control strategy from none to culling (reduced length of symptomatic infection period = 5) slightly increased the number of days it took for the turquoise line to begin to decrease compared to the initial conditions. Under these conditions, it took 25.1 days for the number of infectious-symptomatic people (turquoise line) to begin to decrease and for the number of recovered people (green line) to increase.

Figure 1 Questions
- The authors modified the SIR model to take into account features of the COVID-19 pandemic by adding a D, H, A, T, and E to the normal SIR model. The D of this new model is for people diagnosed (asymptomatic infected and detected). The H of this new model stands for healed, while the R in the new model stands for recognized (symptomatic infected and detected) compared the the R in the normal SIR model stands for recovered. The A of this new model stands for ailing (symptomatic infected but undetected). The T in this new model stands for threatened (acutely symptomatic infected and detected). The E in this new model stands for extinct (i.e. death). Overall, the new additions that this model has takes into account the many different stages that are possible in the COVID-19 pandemic.
- This model has multiple public health policy implications. For one, the model focuses on the importance of differentiating between the severity of the symptoms people are experience. Furthermore, the model also showcases the importance of people being tested in order for the virus to be detected.
University COVID Model Cartoon
- This comic is funny because it is making fun of physics majors (or STEM majors in general) and their lack of a social life. The comic claims that the guy had been invited to multiple parties (for a total of 3 parties while attending undergrad).
Scientific Conclusion
- This exercise introduced the SIR model and how changing the parameters for the model affected the susceptible, infected, and recovered populations. Furthermore, an adjusted SIR model for the COVID-19 pandemic was analyzed to see what COVID-19 specific features were added to the original model.
Template Links
Assignment Pages
- Week 1 Assignment Page
- Week 2 Assignment Page
- Week 3 Assignment Page
- Week 4 Assignment Page
- Week 5 Assignment Page
- Week 6 Assignment Page
- Week 7 Assignment Page
- Week 8 Assignment Page
- Week 9 Assignment Page
- Week 10 Assignment Page
- Week 11 Assignment Page
- Week 12 Assignment Page
- Week 14 Assignment Page
Individual Journal Pages
- Taylor Makela Journal Week 2
- Taylor Makela Journal Week 3
- Taylor Makela Journal Week 4
- Taylor Makela Journal Week 5
- Taylor Makela Journal Week 6
- Taylor Makela Journal Week 7
- FoldamerDB Review
- Taylor Makela Journal Week 9
- Taylor Makela Journal Week 10
- Taylor Makela Journal Week 11
- Comparison of Human and Hamster ACE2 Receptors for SARS-CoV-2 Week 12
- Comparison of Human and Hamster ACE2 Receptors for SARS-CoV-2 Week 14
Class Journal Pages
- Class Journal Week 1
- Class Journal Week 2
- Class Journal Week 3
- Class Journal Week 4
- Class Journal Week 5
- Class Journal Week 6
- Class Journal Week 7
- Class Journal Week 8
- Class Journal Week 9
- Class Journal Week 10
- Class Journal Week 11
- Class Journal Week 12
- Class Journal Week 14
Acknowledgments
- I acknowledge my homework partner, Kam Taghizadeh, who I consulted regarding formatting and content questions
- I copied and modified the protocol shown on the Week 2 page
- Except for what is noted above, this individual journal entry was completed by me and not copied from another source. Taylor Makela (talk) 23:52, 16 September 2020 (PDT)
References
- Epidemix. (2020). Accessed 16 September 2020, from https://www.epidemix.app/#
- Epstein, Joshua M. (2008). 'Why Model?'. Journal of Artificial Societies and Social Simulation 11(4)12. Accessed 16 September 2020, from http://jasss.soc.surrey.ac.uk/11/4/12.html
- Giordano, G., Blanchini, F., Bruno, R., Colaneri, P., Filippo, A., Matteo, A., & Colaneri, M. (22 April 2020). Modelling the COVID-19 Epidemic and Implementation of Population-Wide Interventions in Italy. Accessed 16 September 2020, from https://www.nature.com/articles/s41591-020-0883-7
- [NIMBioS]. (01 April 2020). The Role of Applied Math in Real-Time Pandemic Response: How Basic Disease Models Work [Video]. YouTube. Accessed 16 September 2020, from https://www.youtube.com/watch?v=Ewuo_2pzNNw&feature=youtu.be
- OpenWetWare. (2020). BIOL368/F20:Week 2. Accessed 16 September 2020, from https://openwetware.org/wiki/BIOL368/F20:Week_2
- The SIR Model. (2016). Accessed 16 September 2020 from http://www.pandemsim.com/beta/SIRmodel.html
- University COVID Model. (2020). Accessed 16 September 2020, from https://xkcd.com/2355/
