Natalie Williams Week 9
From OpenWetWare
Jump to navigationJump to search
Week 9 Assignment
To view the assignment for this week, please click here
- (Question 5, p. 110) Choose two genes from Figure 4.6b (PDF of figures on MyLMUConnect) and draw a graph to represent the change in transcription over time. You can either create your plot in Excel and put the image up on your wiki page or you can do it in hard copy and turn it in in class.
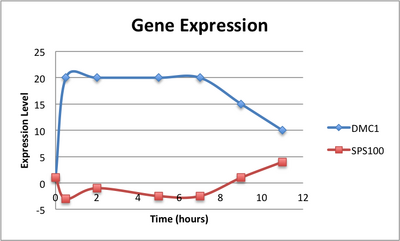
This plot traces the gene expression of two genes.
- (Question 6b, p. 110) Look at Figure 4.7, which depicts the loss of oxygen over time and the transcriptional response of three genes. These data are the ratios of transcription for genes X, Y, and Z during the depletion of oxygen. Using the color scale from Figure 4.6, determine the color for each ratio in Figure 4.7b. (Use the nomenclature "bright green", "medium green", "dim green", "black", "dim red", "medium red", or "bright red" for your answers.)
- gene X
- 1 hour: black
- 3 hour: dim red
- 5 hour: black
- 9 hour: medium green
- gene Y
- 1 hour: black
- 3 hour: bright red
- 5 hour: dim green
- 9 hour: bright green
- gene Z
- 1 hour: black
- 3 hour: dim red
- 5 hour: dim red
- 9 hour: dim red
- gene X
- (Question 7, p. 110) Were any of the genes in Figure 4.7b transcribed similarly? If so, which ones were transcribed similarly to which ones?
- Yes, genes X and Y were transcribed similarly. Both were initially activated/induced, but by hour 5 they had reached originally expression levels or below, in the case of gene Y.
- (Question 9, p. 118) Why would most spots be yellow at the first time point? I.e., what is the technical reason that spots show up as yellow - where does the yellow color come from? And, what would be the biological reason that the experiment resulted in most spots being yellow?
- There are many yellow spots at the first time point because there is an overlap of green and red expression levels. The yellow color suggests that the specific gene was expressed in both conditions. It appears yellow because the cell has not adjusted itself yet to accommodate to the different conditions of the environment.
- (Question 10, p. 118) Go to the Saccharomyces Genome Database and search for the gene TEF4; you will see it is involved in translation. Look at the time point labeled OD 3.7 in Figure 4.12, and find the TEF4 spot. Over the course of this experiment, was TEF4 induced or repressed? Hypothesize why TEF4’s change in expression was part of the cell’s response to a reduction in available glucose (i.e., the only available food).
- TEF4 was down regulated or repressed. In the experiment, glucose became a limited resourced. When the cell sensed that its food source was depleting, it began to repress the expression of genes that breaks down glucose. As the cell shifts to aerobic respiration, ethanol and glucose as carbon sources decrease so that the cell turns off expression in the genes involved with glucose and ethanol.
- (Question, 11, p. 120) Why would TCA cycle genes be induced if the glucose supply is running out?
- TCA genes would be induced due to a sense of depleting glucose levels. The yeast cell would convert a secondary source of carbons - ethanol - into a food source to continue to reproduce and compete with other cells. This ethanol would then be converted to acetal CoA to be used in the TCA cycle. From there, cellular respiration occurs to make more ATP for the cell to utilize as energy.
- (Question 12, p. 120) What mechanism could the genome use to ensure genes for enzymes in a common pathway are induced or repressed simultaneously?
- The genome could have genes within the same cluster share the a common repressor or activator transcription factor. These proteins would sense the conditions of the external environment to help regulate the rate at which genes are being produced and expressed.
- (Question 13, p. 121) Consider a microarray experiment where cells deleted for the repressor TUP1 were subjected to the same experiment of a timecourse of glucose depletion where cells at t0 (plenty of glucose available) are labeled green and cells at later timepoints (glucose depleted) are labeled red. What color would you expect the spots that represented glucose-repressed genes to be in the later time points of this experiment?
- I would expect to see red for increase amounts of these genes. Because TUP1 was deleted, it cannot down-regulate these glucose-repressed genes, which means that there will be an increase of expression for them.
- (Question 14, p. 121) Consider a microarray experiment where cells that overexpress the transcription factor Yap1p were subjected to the same experiment of a timecourse of glucose depletion where cells at t0 (plenty of glucose available) are labeled green and cells at later timepoints (glucose depleted) are labeled red. What color would you expect the spots that represented Yap1p target genes to be in the later time points of this experiment?
- I would expect to see red spots as well because Yap1p codes for the resistance of environmental stresses. This means that even though less glucose is available, the overexpression of Yap1p calls for particular cells that would decrease their expression to continue to express themselves at the same level or at an increased rate.
- (Question 16, p. 121) Using the microarray data, how could you verify that you had truly deleted TUP1 or overexpressed YAP1 in the experiments described in questions 8 and 9?
- Using microarray data, you would be able to know if TUP1 was deleted if its chip was black. For YAP1 overexpression, the chip for its gene would have a red color that is either medium red or bright red.

To view my Class Journal Response
Back to User Page: User:Natalie Williams
To view the Course and Assignments:BIOL398-04/S15
- Week 1
- Week 2
- Week 3
- Week 4
- Week 5
- Week 6
- Week 7
- Week 9
- Week 10
- Week 11
- Week 12
- Week 13
- Week 14
- Week 15
