Natalie Williams Week 3
From OpenWetWare
Jump to navigationJump to search
Week 3
To view the Week 3 Assignment
Part One
- The script for Part One for Assignment 3: Part One Script
- The excel output from the script for Part One: Part One Excel File
- The graph for Part One can be seen here:
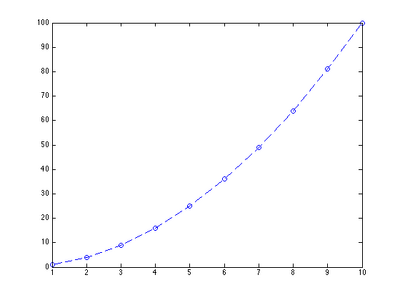
This is a graph of v vs. u with v on the y-axis and u on the x-axis.
Part Two
- To view the script and function file: Part Two Script
- For the input of x0 = [0.00001 1], the answer was:
0.5671

Part Three
- Part Three took quite a bit of time for me, especially getting used to the formatting and how MATLAB reads scripts. After those problems were figured out and emailing my professor back and forth, I finally got the output I was hoping for.


To view the Class Journal Week 3
Back to User Page: User:Natalie Williams
To view the Course and Assignments:BIOL398-04/S15
- Week 1
- Week 2
- Week 3
- Week 4
- Week 5
- Week 6
- Week 7
- Week 9
- Week 10
- Week 11
- Week 12
- Week 13
- Week 14
- Week 15
