Moneil5 Week 5
Helpful Links
Assignment Pages:
- Week 1 Assignment
- Week 2 Assignment
- Week 3 Assignment
- Week 4 Assignment
- Week 5 Assignment
- Week 6 Assignment
- Week 7 Assignment
- Week 9 Assignment
- Week 10 Assignment
- Week 11 Assignment
- Week 12 Assignment
- Week 14/15 Assignment
Personal Journal Entries:
- Week 1
- Week 2
- Week 3
- Week 4
- Week 5
- Week 6
- Week 7
- Week 7 Re-visited
- Week 9
- Week 10
- Week 11
- Week 12
- Week 14/15
Shared Journal Entries:
Purpose
The purpose of this week's assignment is to better understand how the nutrient models from the Week 4 assignment work, and to understand the mathematics behind such models through solving the equations by hand. The purpose of this assignment is also to better understand the shortcomings of certain models.
Methods/Workup
- Started by looking at the questions and the Model 2 solutions and thinking about how to derive those solutions from the model
- Went through and solved the solutions according to the file that can be found in the results section of this entry
- Created a first attempt at a matlab function and script in order to answer part 3 of the assignment. Used Dr. Fitzpatrick's help when figuring out what to put in for the inputs of x0 and tt
- After running the script and function as shown, went back and asked Dr. Fitzpatrick for help again on what to put in for x0. He suggested inputting the equilibrium values, so I went about solving for the equilibrium of each equation in terms of c1, c2, and y.
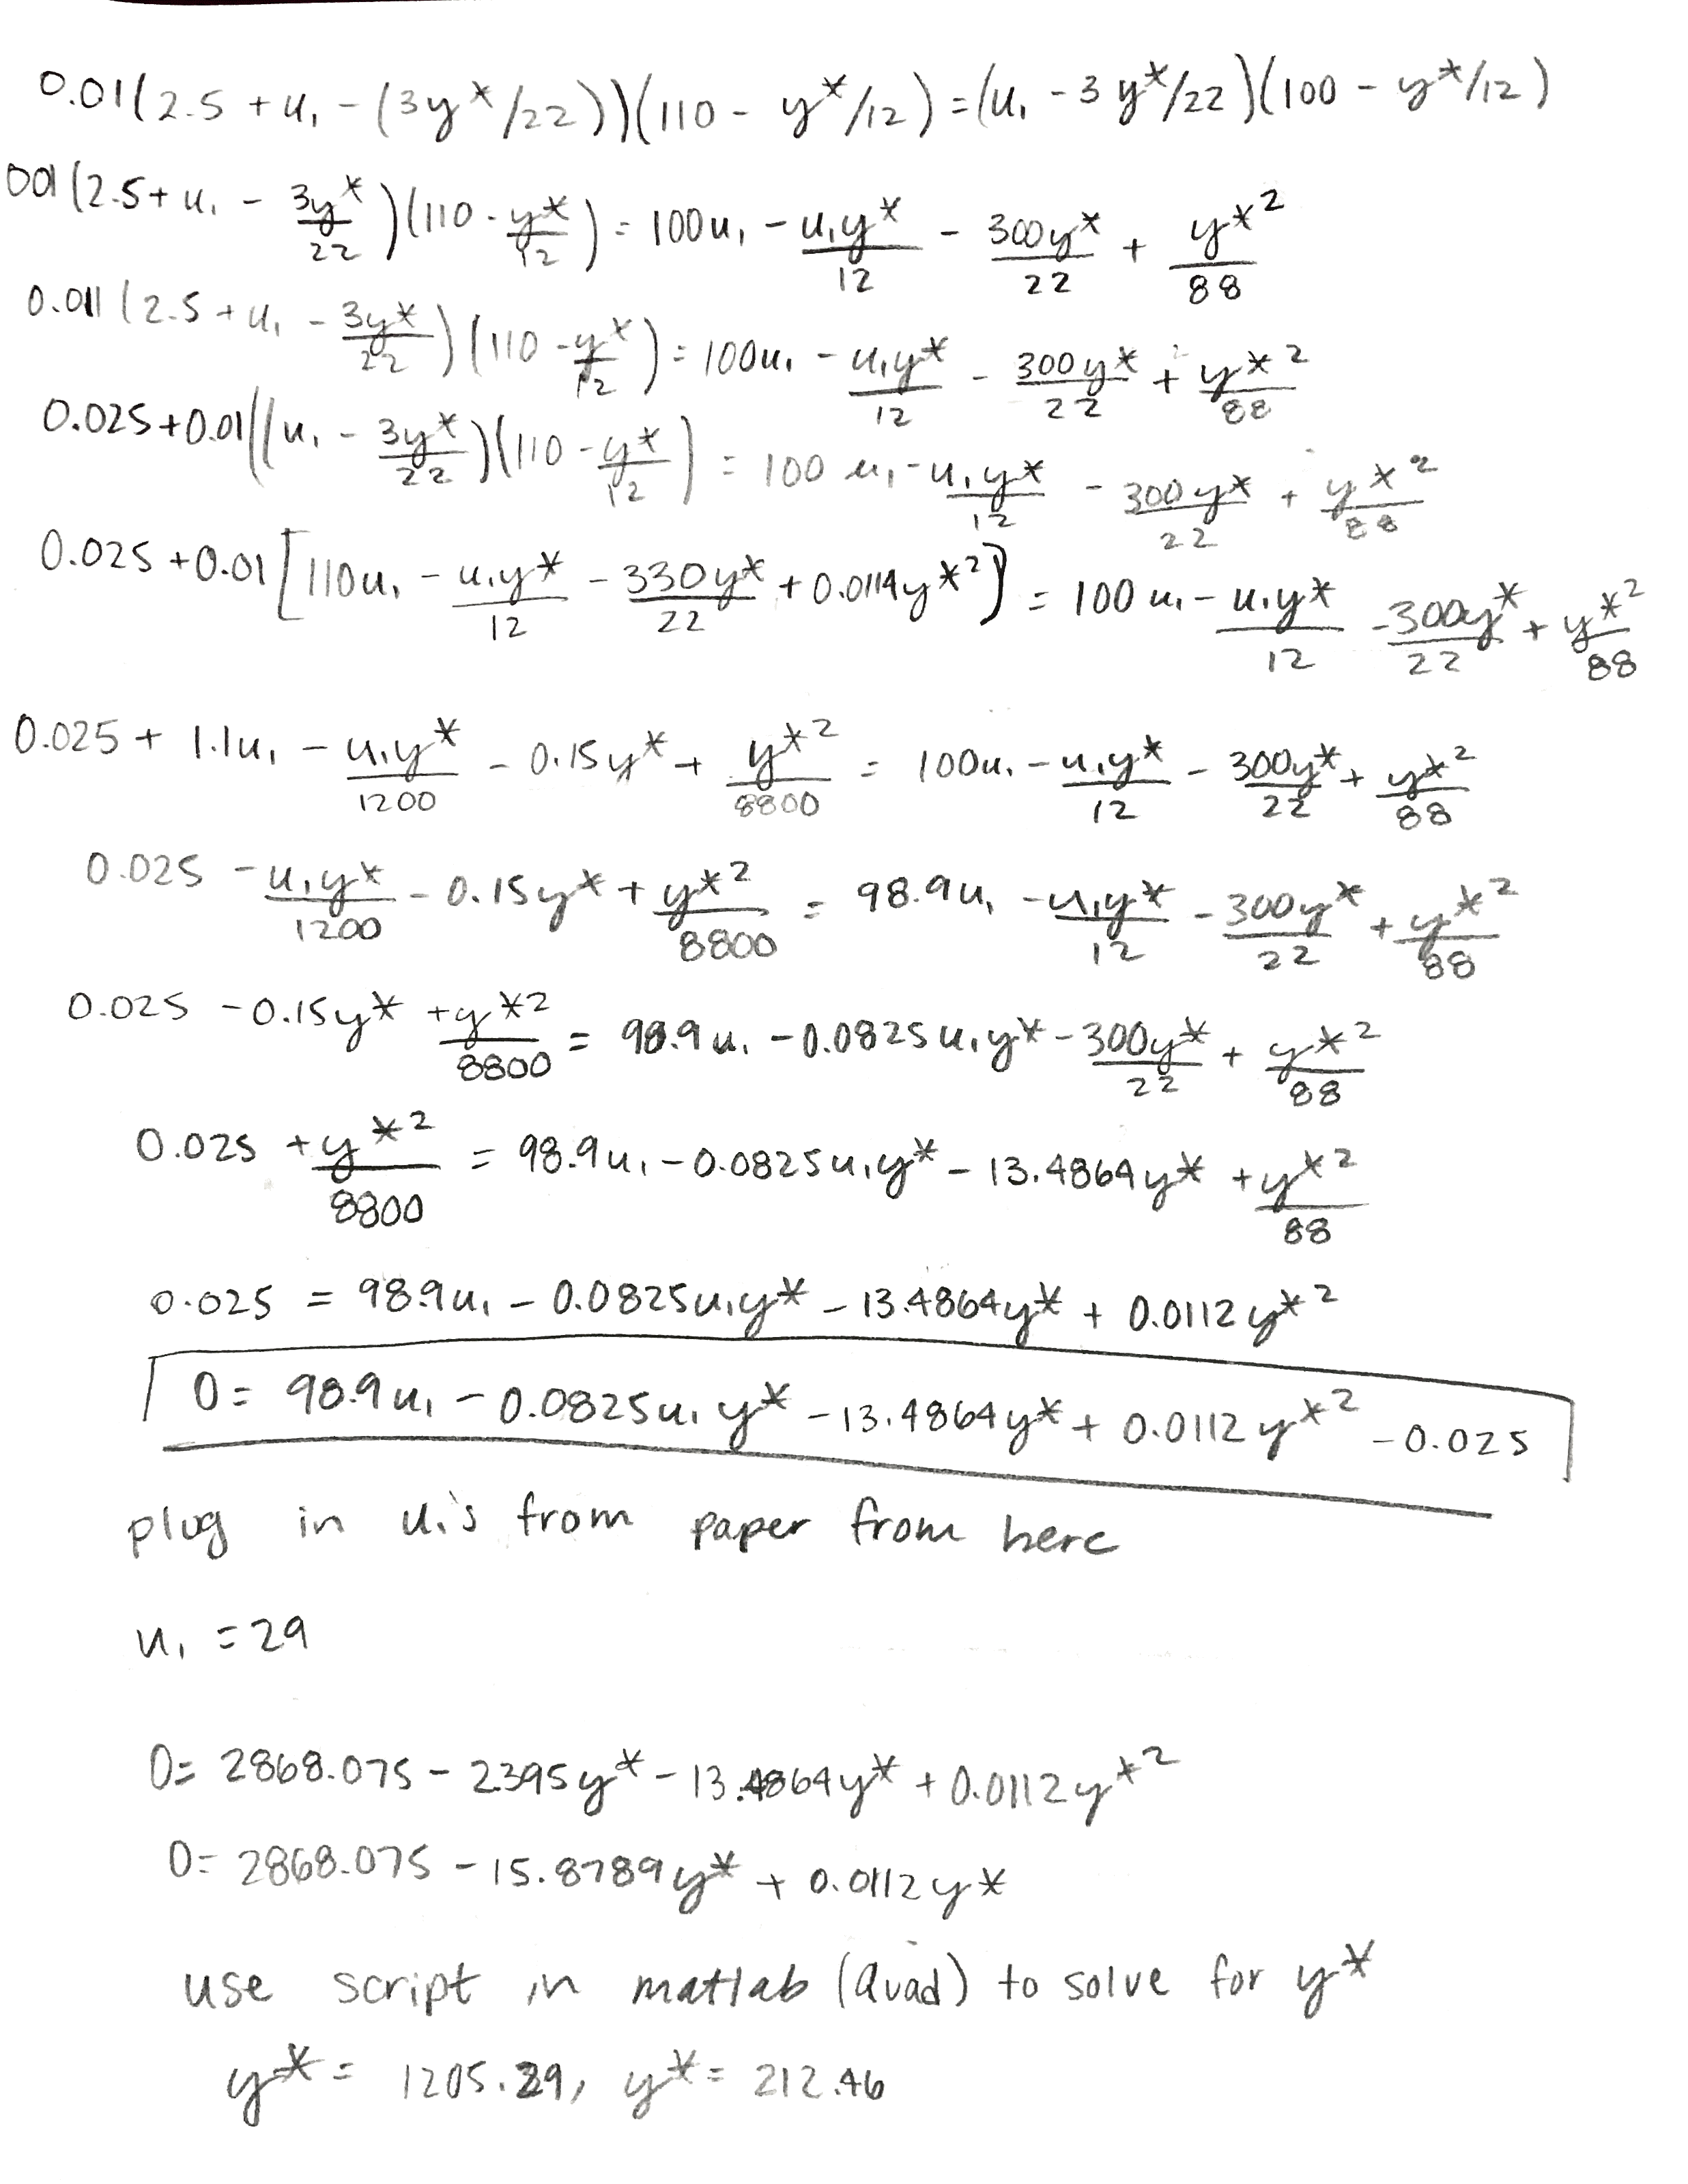
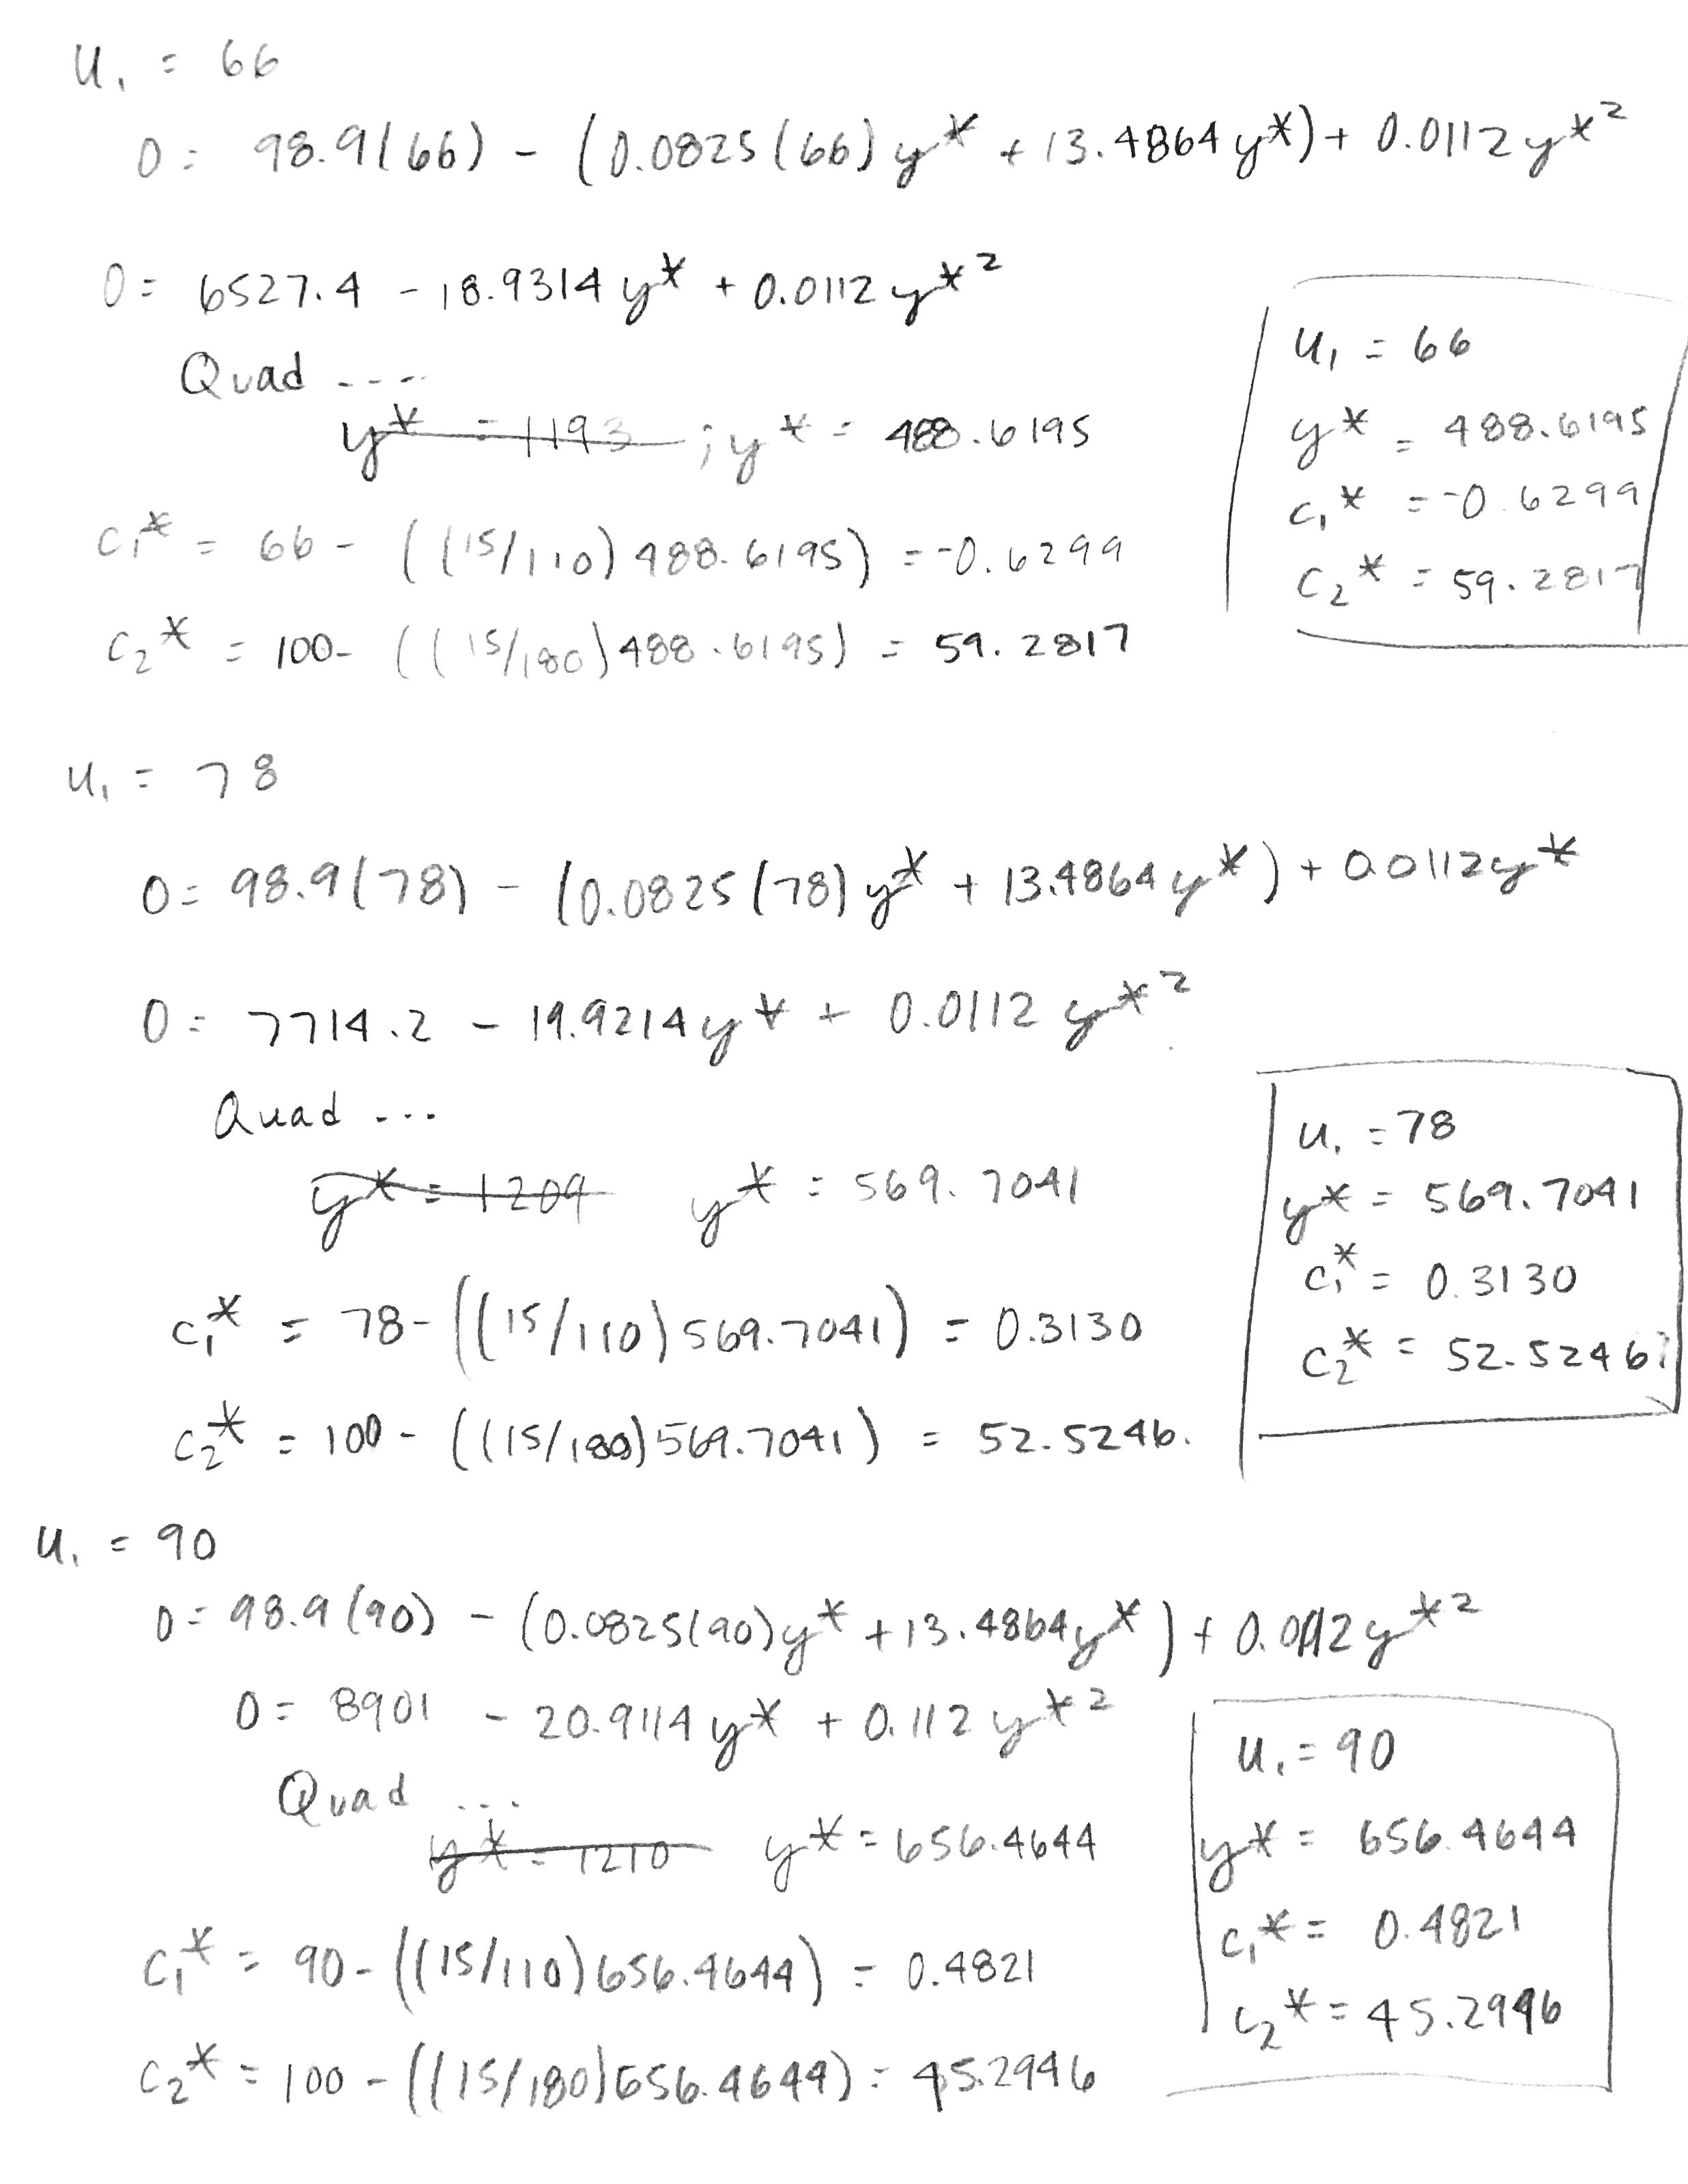
- Went back and solved the non-trivial equilibrium equation in terms of y and u1 so that the u1 variable could be changed and outputs quickly obtained for each u1
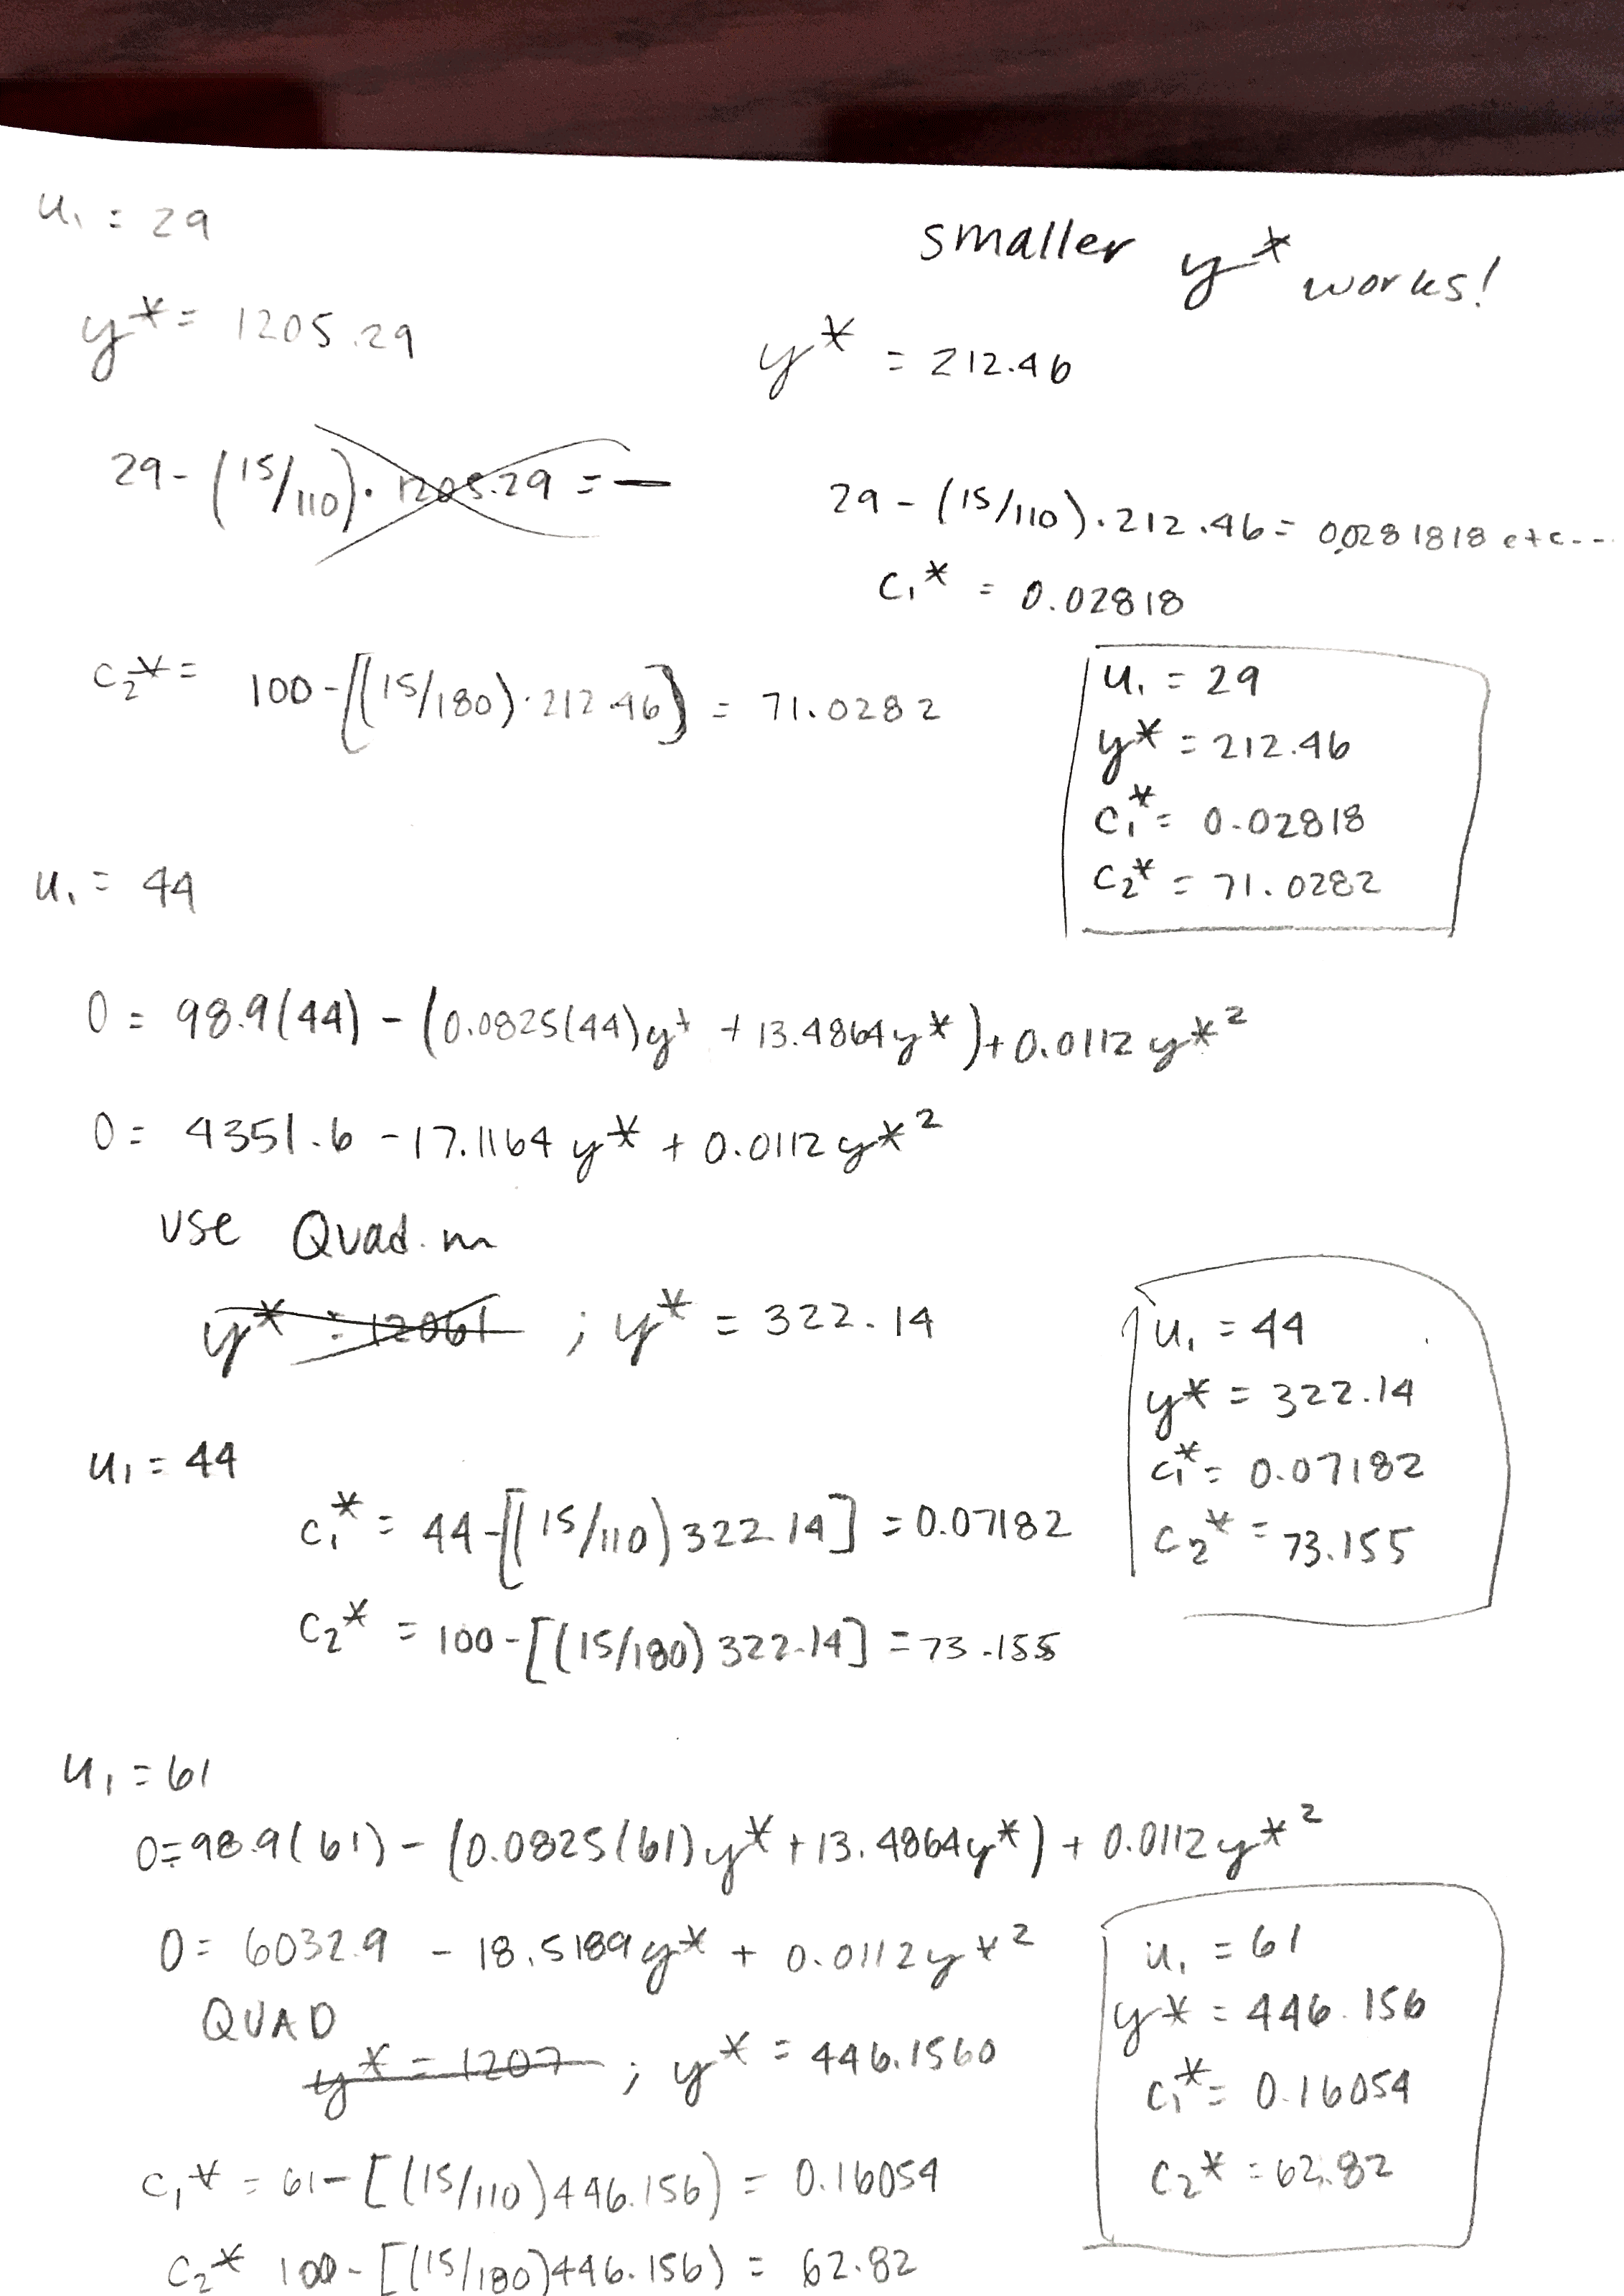
- Created a quadratic formula solver in matlab to aid in this process
- Using the outputs of u1, c1, c2, and y, created a series of vectors in matlab and then plotted (see graphs in results below)
- Went back and solved for the model 3 non-trivial equilibriums
Results
- The additive model does not seem like it would be the best model to go with because in referencing the ter Schure paper, the yeast population needs two nutrients to grow - glucose and ammonia. Using this additive model is saying that the yeast population can use glucose or ammonia to grow, which is too simplistic of a model for the process that is being observed, because this means the yeast could totally deplete the glucose, and then use the ammonia until it runs out. Given that this additive process is not the best model the other two models should be looked at to see if one of those is a better fit.
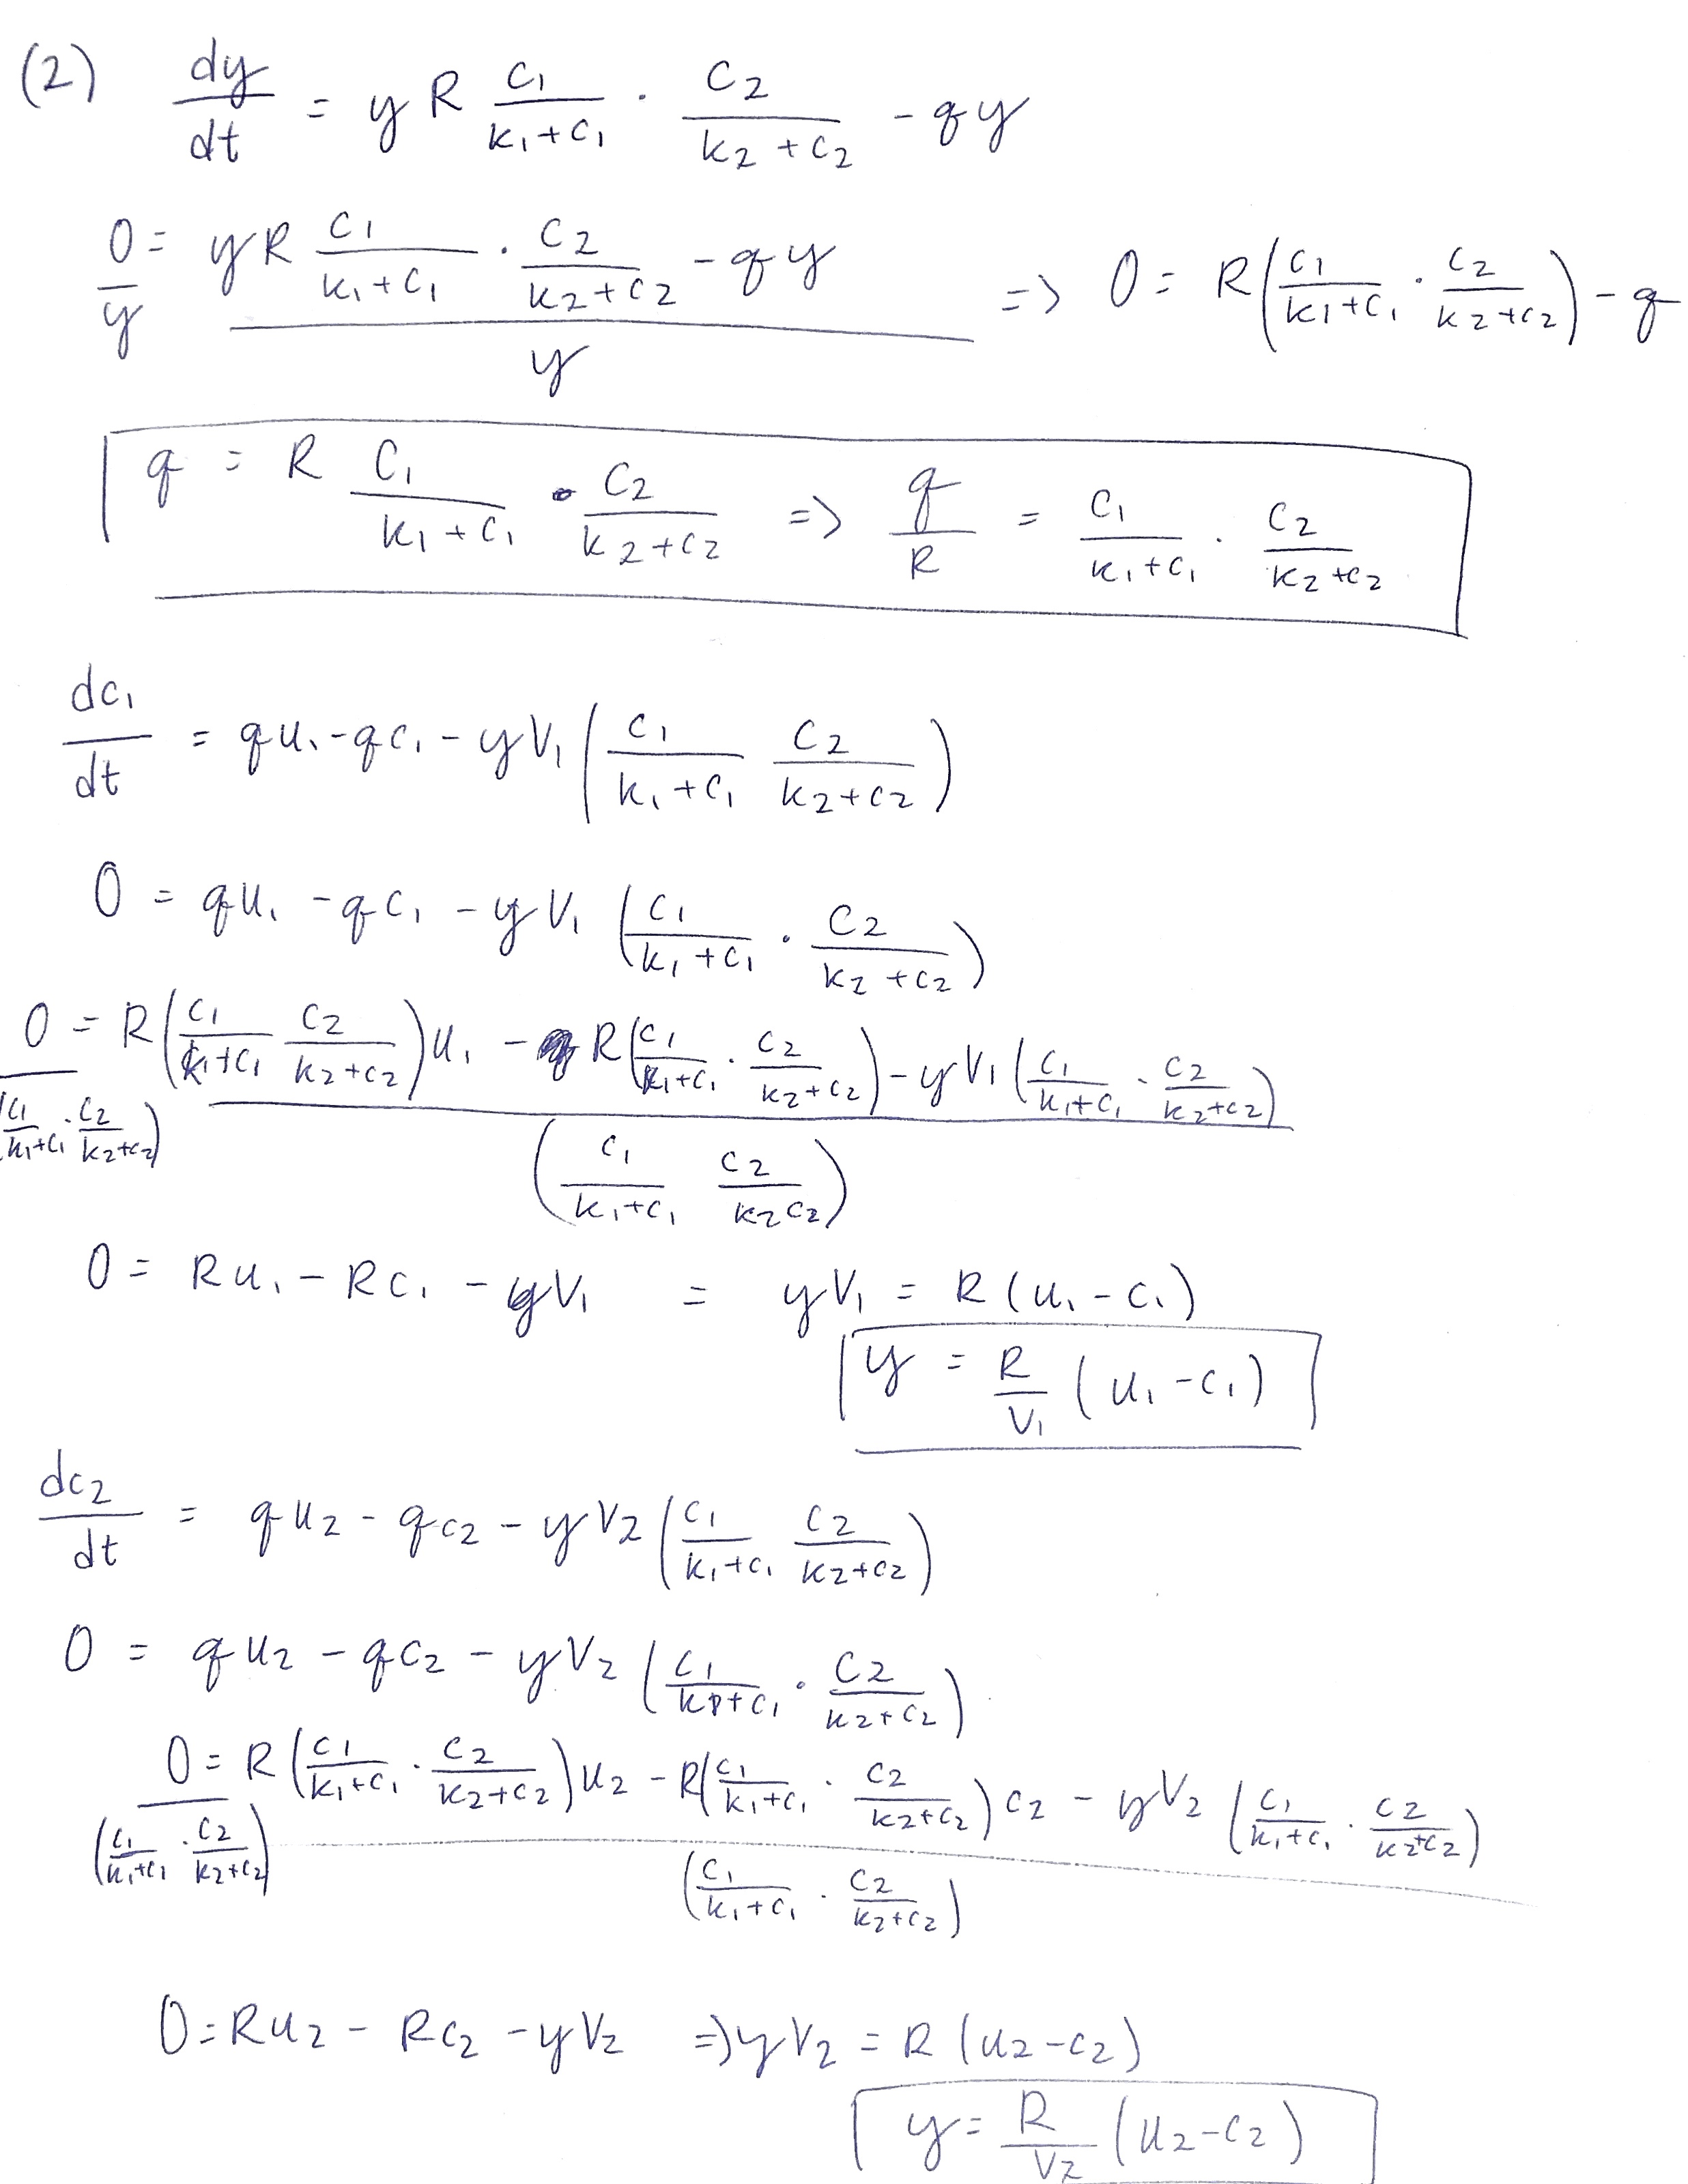
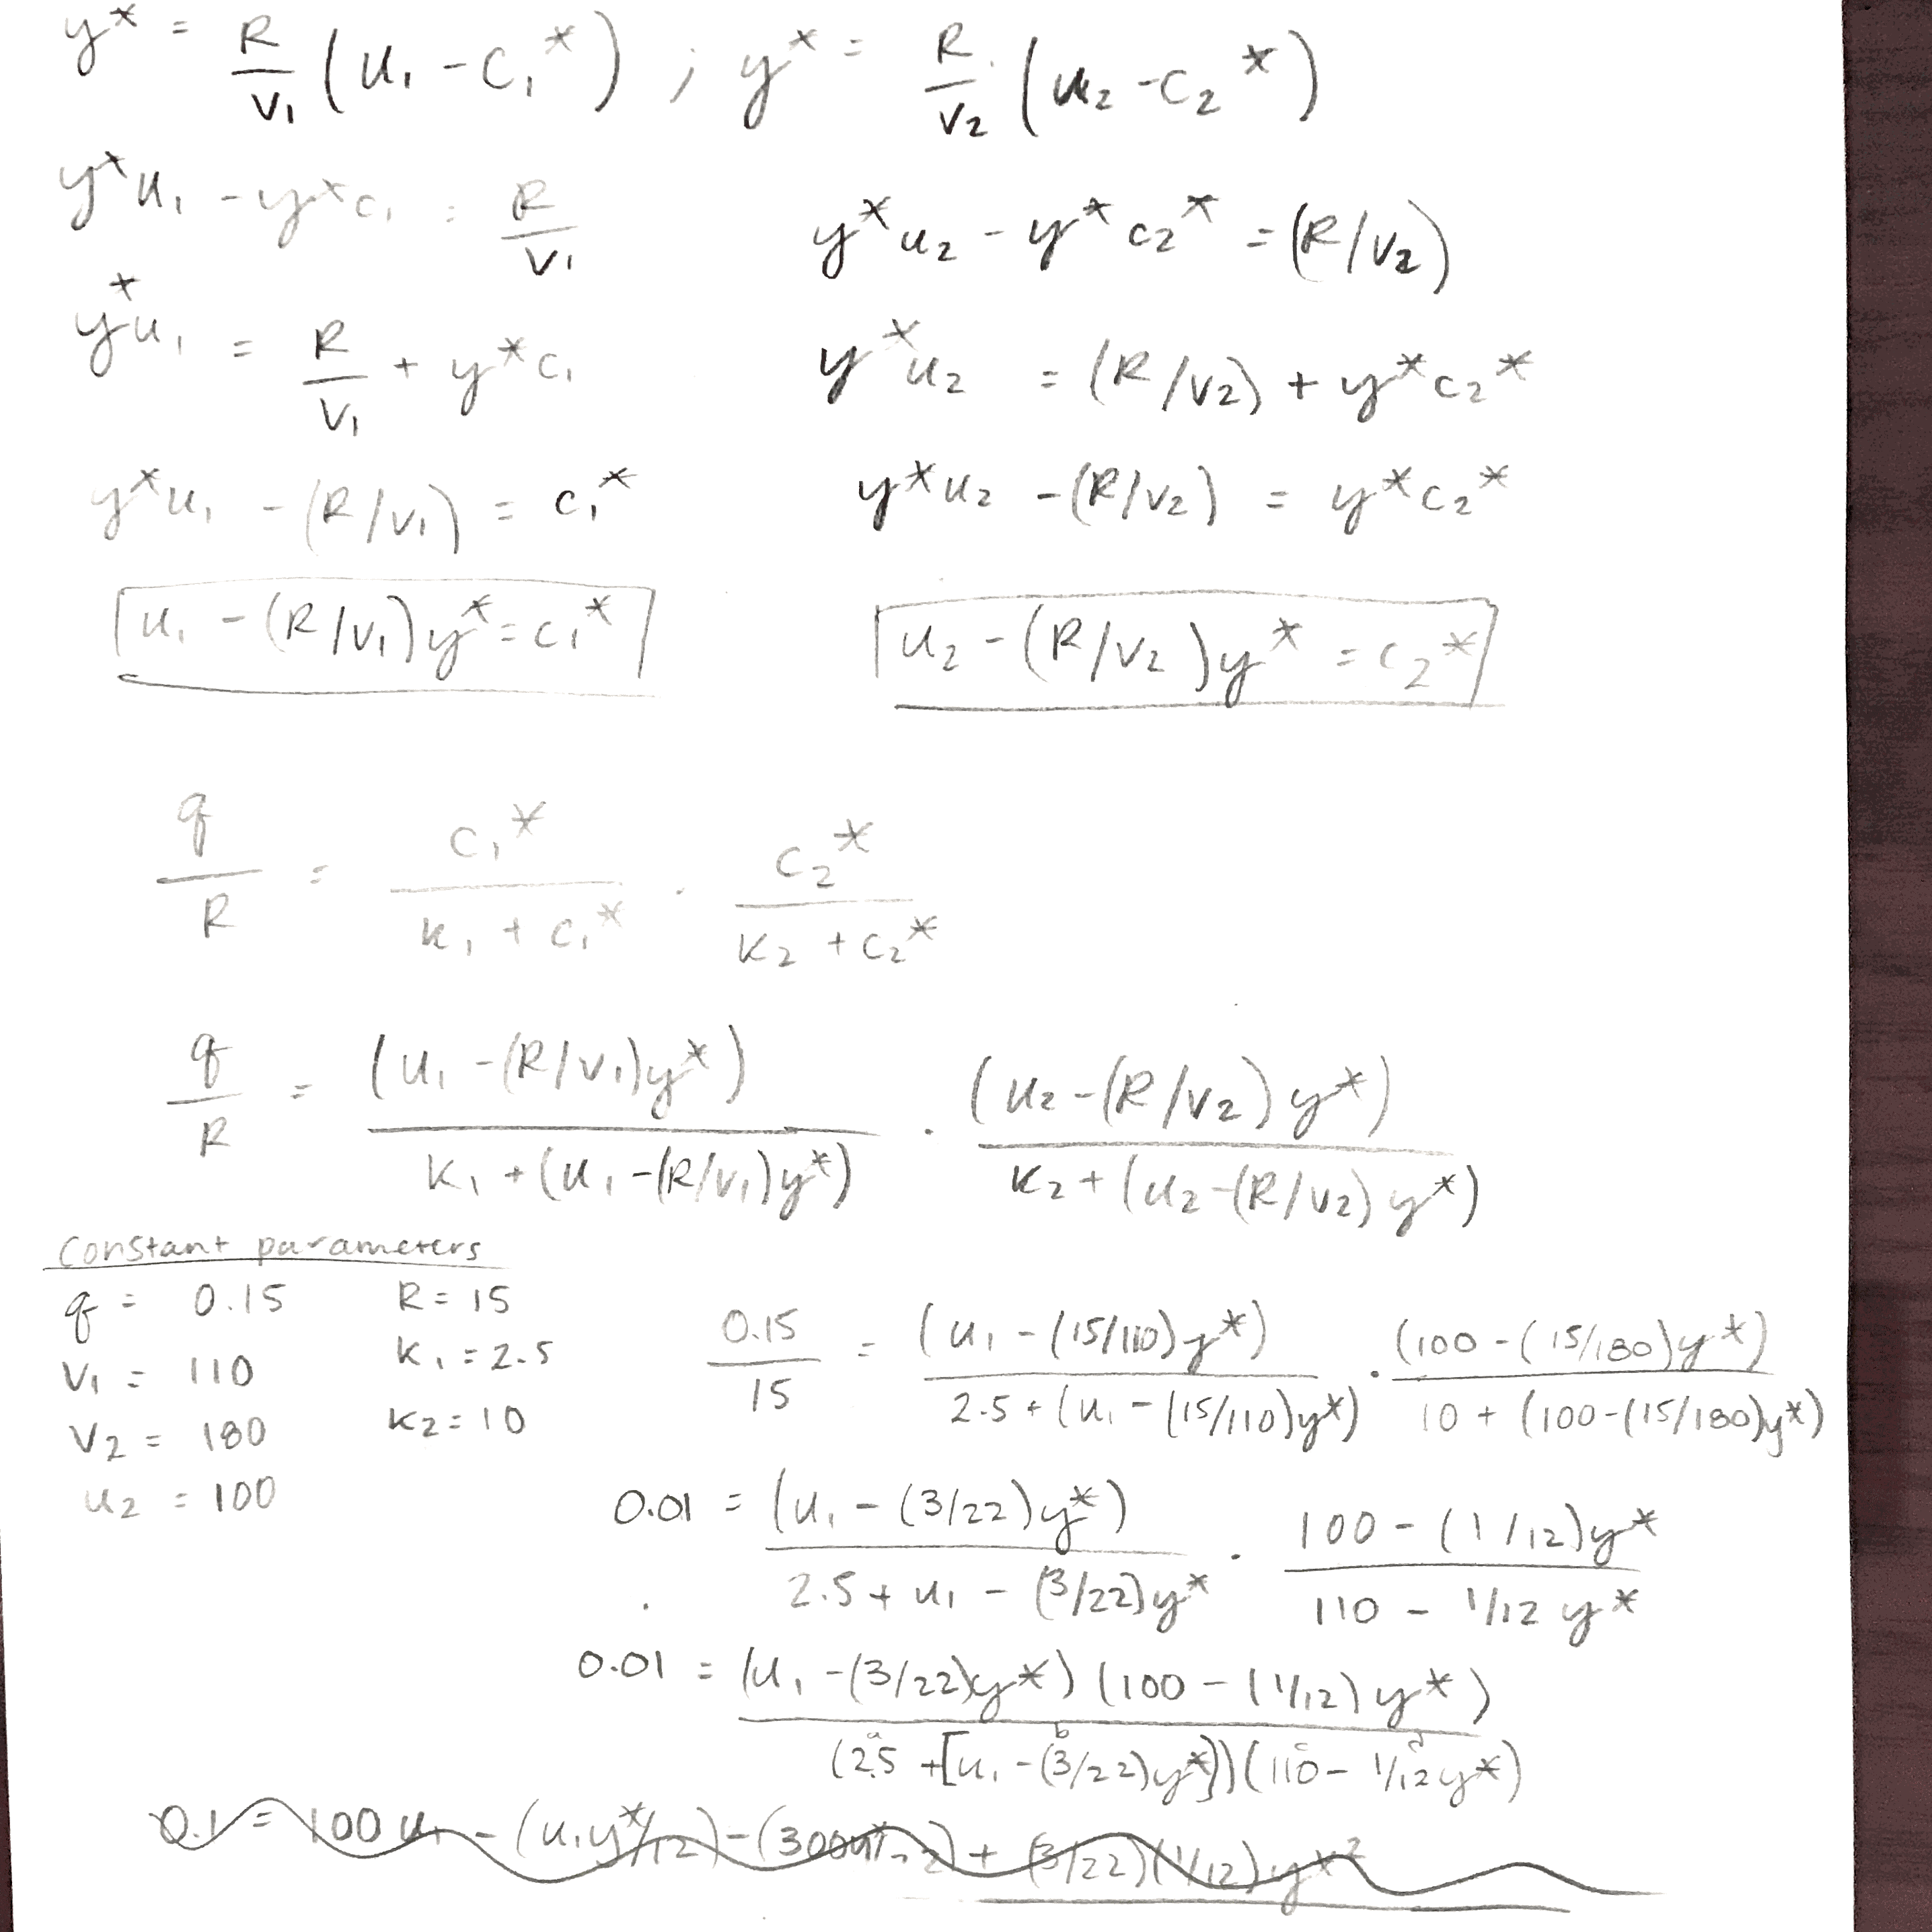
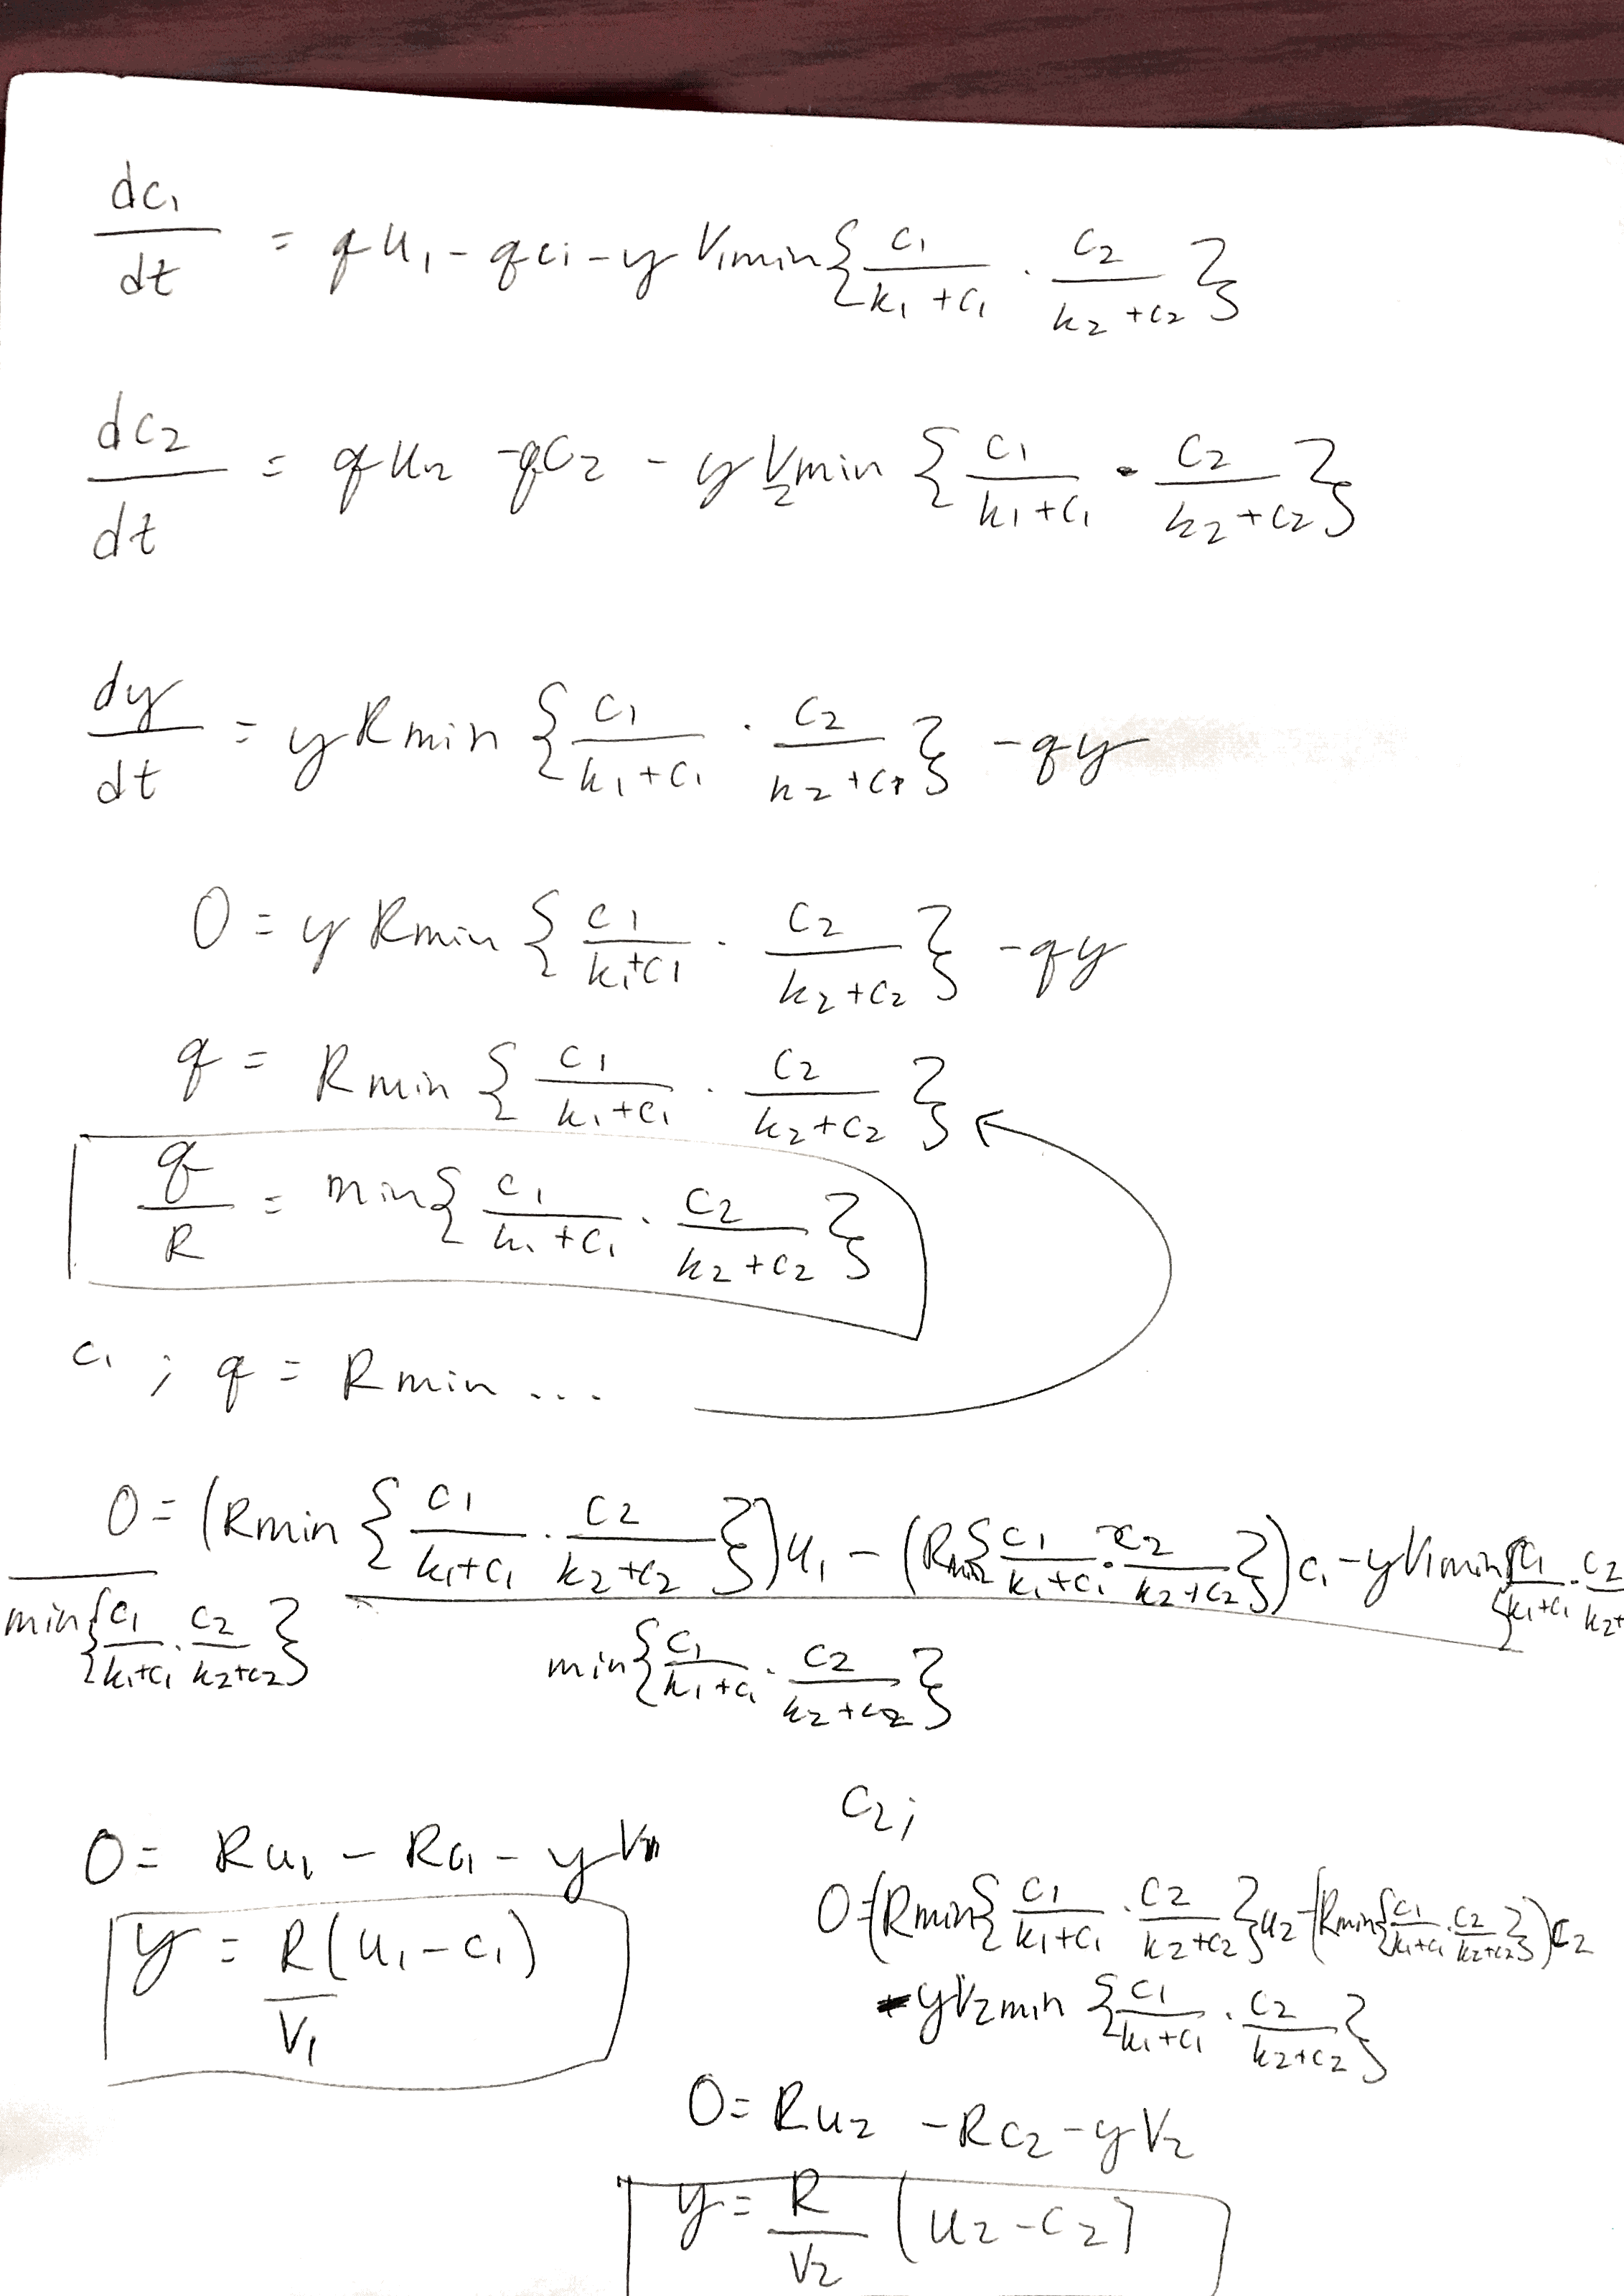
- Equilibrium solutions were found through solving the differential equations. Solutions can be found here
- Calculations for creating the graphs were done to generate the plots. Calculations can be found here, here, here and here
- MATLAB Script 'Quad.m' was created and is referenced throughout calculation notes
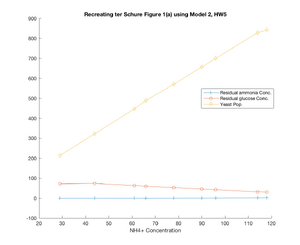
Figure 1. Compilation of all plots 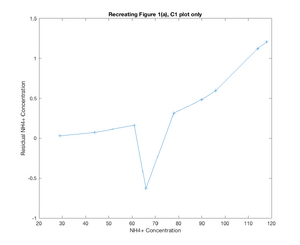
Figure 2. Residual Ammonium plot only 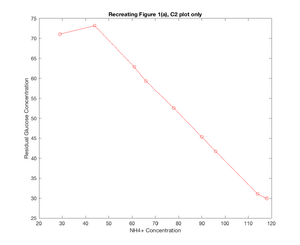
Figure 3. Residual Glucose plot only 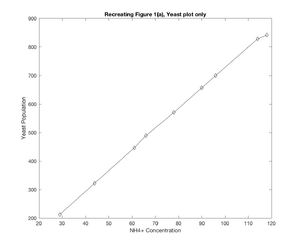
Figure 4. Yeast Population plot only
- Model 3 in the homework is very similar to Model 2, except in Model 3 the growth rate of the yeast is limited by the minimum of the conversion rate functions, though the model is still a product model in which the yeast require the presence of both nutrients in order to grow. There are analogous equations to those found in question 2, and the algebra to solve for them can be found here
Conclusions
- Through this assignment, it was found that when a population requires two food sources for growth ( in this case ammonia and glucose), the multiplicative nutrient use model is required to model the population consuming the nutrients at the same time. This model, when solved non-trivially, can be used to determine the equilibrium values at which the population and food sources remain stable based on a variety of set input parameters. Getting a fist-hand experience in using this model and utilizing MATLAB to quickly solve for the equilibrium values of a set series of parameters helped me gain an appreciation for how effective modeling can be, and how helpful MATLAB can be in both visualizing and doing the grunt work for some of the solving that is tedious to do by hand.
- While the figure with all the plots on it does not demonstrate the similarity quite as well, in seeking to recreate Figure 1(a) from the ter Schure paper, Model 2 did a fairly good job of recreating what was seen in the original figure. At u1 = 61, a change is seen in the residual ammonia concentration, where the concentration falls suddenly, and then picks back up, while the glucose concentration more sharply declines and the yeast population spikes. Granted, these changes might be read into a little too closely based on the different shapes of my plots, but there was a change seen around u1-61 ~ u1=66 which was similar to that seen in the ter Schure paper even if it wasn't as drastic of a change. The one downside to the model as I solved for it is that the residual glucose concentration is not modeled as consistently as what was seen in the ter Schure paper, and interestingly this model for glucose more similarly matches the stretch of Figure 1(b) (ter Schure) that demonstrated fermentation rather than aerobic respiration.
Acknowledgments
- Worked with Lauren M. Kelly on Sunday, February 12 in Seaver 120 to solve the equilibrium equations for Model 2
- E-mailed Dr. Fitzpatrick on Tuesday night and Wednesday afternoon for clarification on how to generate the Figure 1(a) plot from the ter Schure paper. He instructed me to try using the equilibrium values for the x0 inputs
- Worked with Lauren M. Kelly and Cameron M. Rehmani Seraji on Wednesday afternoon when generating the Figure 1(a) graph on matlab
- Except for what is noted above, this individual journal entry was completed by me and not copied from another source.
- Texted Nika Vafadari on Wednesday night to help solve problem and review MATLAB plot functions
Margaret J. Oneil 19:07, 15 February 2017 (EST)
References
Dahlquist, Kam D. (2017) BIOL398-05/S17:Week 5. Retrieved from http://www.openwetware.org/wiki/BIOL398-05/S17:Week_5 February 2017.
ter Schure, E. G., Sillje, H. H., Verkleij, A. J., Boonstra, J., & Verrips, C. T. (1995). The concentration of ammonia regulates nitrogen metabolism in Saccharomyces cerevisiae. Journal of bacteriology, 177(22), 6672-6675.
