Lkelly9 Week 7
Navigation Links
- Lauren M. Kelly
- Assignment Page
- Individual Journal Entry
- Shared Journal Page
Purpose
The purpose of this assignment is to apply all of the modeling skills we have learned to a specific project in which we will learn more about the behavior of yeast and attempt to model how the population reacts to changes in nitrogen or glucose. This assignment will also prepare us to present our work in class.
Workflow/Methods
February 26th
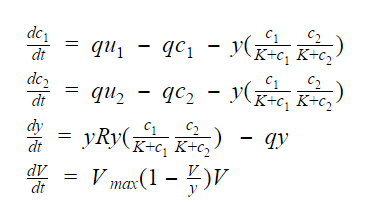
- Created an updated version of my differential equations and attempted to run them in MATLAB
- The "yRy" in the third equation is a typo. It should just be yR.
- Used the script below. Will make changes to the plot labels to better reflect my model
global q u1 u2 y K1 K2 V R
q= 0;
u1= 20;
u2 = 30;
y = 4;
K1 = 3;
K2 = 7;
R = 0.76;
V= 56;
tt = 0:0.1:10;
x0 = [1;2];
[t,x] = ode45('week7projectfunction',tt,x0);
plot(t,x)
xlabel('time')
ylabel('abundance')
title('Population and food source over time')
legend('Population','Food')
- Used the function below.
- When I tried to run it, I kept getting an error that said "'week7projectfunction' requires more input arguments to run." It appears that there is a possible problem with the (t,x).
function dx = week7projectfunction(t,x)
global q u1 u2 y K1 K2 V R
dx = zeros(size(x));
dx(1) = (q*u1) - (q*x(1)) - x(3)*((x(1))/((x(1))+K1))*((x(2))/((x(2))+K2));
dx(2) = (q*u2) - (q*x(2)) - x(3)*((x(1))/((x(1))+K1))*((x(2))/((x(2))+K2));
dx(3) = (x(3))*R*((x(1))/((x(1))+K1))*((x(2))/((x(2))+K2))-(q*y);
dx(4) = V(1-(V/y))*V;
end
March 1st
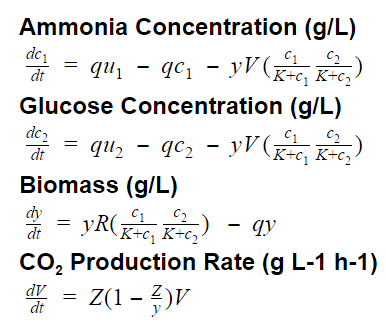
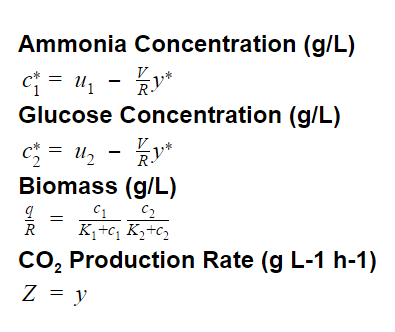
- Revised and finalized my equations, as well as solved for the steady states.
- Plotted equations in MATLAB and manipulated the variables in order to observe the model in action.
- The code below was used.
global q u1 u2 y K1 K2 V R Z
q= 6;
u1= 100;
u2 = 100;
y = 10;
K1 = 3;
K2 = 5;
R = 150;
V = 100;
Z = 5;
tt = 0:0.1:1;
x0 = [400;300;50;0];
[t,x] = ode45('week7function',tt,x0);
plot(t,x)
xlabel('time')
ylabel('abundance')
title('Population and Fermentation')
legend('Population','Food')
- The function below was used.
function dx = week7function(t,x)
global q u1 u2 y K1 K2 V R Z
dx = zeros(size(x));
dx(1) = (q*u1) - (q*x(1)) - x(3)*V*((x(1))/((x(1))+K1))*((x(2))/((x(2))+K2));
dx(2) = (q*u2) - (q*x(2)) - x(3)*V*((x(1))/((x(1))+K1))*((x(2))/((x(2))+K2));
dx(3) = y*R*((x(1))/((x(1))+K1))*((x(2))/((x(2))+K2))-(q*y);
dx(4) = Z*(1-(Z./y)).*V;
end
Results
Hypothesis
- As in ter Schure et al. (1995), increasing the concentration of ammonia (nitrogen) will increase the biomass of the yeast.
- The increase in yeast biomass will lead to the increase in CO2 production (fermentation) seen in Albertin et al. (2011).
- I am attempting to make a connection between trends found in the two papers.
MATLAB Graphs
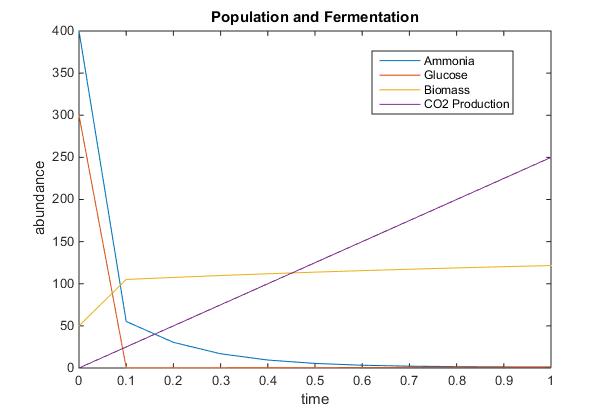
- In this graph, the nitrogen and glucose concentrations were both set to 100. The model appears to be behaving in line with my hypothesis. The CO2 production increases as the biomass increases. However, does the CO2 production increase with the nitrogen concentration?
- In this graph, there is no observed change in CO2 production when the concentration of nitrogen is doubled to 200. This indicates that my model is not accurately representing the population, or that there is no connection between nitrogen concentration and CO2 production.
Conclusion
While I was able to develop and run a model in MATLAB, I am not sure it was successful in modeling the yeast population or my hypothesis. As seen in the graphs, increasing the concentration of nitrogen does not affect any of the other variables in my equation. Based on the ter Schure paper and the Albertin paper, I expected the increase in nitrogen to increase both the biomass and the CO2 production, but none of these variables were affected. This result leads me to believe that either the connection I aimed to model does not exist or my equations need work. The latter is likely, as I am still not confident that I connected the CO2 production equation to the other equations.
Acknowledgements
- Worked with Cameron M. Rehmani Seraji and Margaret J. O'Neil in Seaver 120 on March 1st. We discussed the formatting of the presentation.
- Emailed Dr. Fitzpatrick about my MATLAB code on February 28th and March 1st. He was able to help me get it to work.
- Except for what is noted above, this individual journal entry was completed by me and not copied from another source.
Lauren M. Kelly 18:45, 26 February 2017 (EST)
References
- Albertin, W., Marullo, P., Aigle, M., Dillmann, C., de Vienne, D., Bely, M., & Sicard, D. (2011). Population Size Drives Industrial Saccharomyces cerevisiae Alcoholic Fermentation and Is under Genetic Control . Applied and Environmental Microbiology, 77(8), 2772–2784. http://doi.org/10.1128/AEM.02547-10
- Dahlquist, Kam D. (2017) BIOL398-05/S17:Week 7. Retrieved from http://www.openwetware.org/wiki/BIOL398-05/S17:Week_7 on 26 February 2017.


