Lkelly9 Week 4
Navigation Links
- Lauren M. Kelly
- Assignment Page
- Individual Journal Entry
- Shared Journal Page
Electronic Lab Notebook
Purpose
The purpose of this assignment is to create and manipulate three different nutrient/cell population models. The population is growing inside of a chemostat. Different constants and parameters were manipulated in order to model the effect on the population and the amount of food.
Methods/Workflow
- Week 4 Assignment PDF was referenced for the directions of this assignment.
- Created the function 'ChemostatLK.m'
function dx = ChemostatLK(t,x)
global q u V K r
dx = zeros(size(x));
dx(1) = (q*u) - (q*x(1)) - x(2)*((V*x(1))/(x(1)+K));
dx(2) = -(q*x(2)) + ((r*x(2))*(V*x(1))/(x(1)+K));
end
- Created the script 'ChemostatscriptLK.m'
global q u V K r
q= 0;
u= 1;
V= 56;
K= 40;
r= 6;
tt = 0:0.1:10;
x0 = [1;2];
[t,x] = ode45('ChemostatLK',tt,x0);
plot(t,x)
xlabel('time')
ylabel('abundance')
title('Population and food source over time')
legend('Population','Food')
- Put in various values for the variables to see how the population reacted.
- Added a linear mortality term, (-dx(2)), to the function
function dx = ChemostatLK(t,x)
global q u V K r d
dx = zeros(size(x));
dx(1) = (q*u) - (q*x(1)) - x(2)*((V*x(1))/(x(1)+K));
dx(2) = -(q*x(2)) + ((r*x(2))*(V*x(1))/(x(1)+K)) - (d*x(2));
end
- Put in various values for the variables to see how the population reacted.
- Added a second nutrient that is required for the population to grow
function dx = ChemostatLK(t,x)
global q u V K r
dx = zeros(size(x));
dx(1) = (q*u) - (q*x(1)) - x(2)*((V*x(1))/(x(1)+K));
dx(2) = -(q*x(2)) + ((r*x(2))*(V*x(1))/(x(1)+K));
dx(3) = (q*u) - (q*x(3)) - x(2)*((V*x(1)+x(3))/(x(1)+x(3)+K));
end
Results
Consider the nutrient/cell population model
- First, make sure you understand which variables are the state variables (dependent variables that determine the concentrations) and which variables are parameters (e.g., rate constants).
- The state variables are:
- consumption rate = -yVmax(c/K+c)
- Variables are y and c
- consumption rate = -yVmax(c/K+c)
- The parameters are
- inflow rate = q*u
- outflow rate = q*c(t)
- outflow rate = -qy
- r = net growth rate
- The state variables are:
- Find values of c and y that hold the system in equilibrium: that is, find values of c and y for which constant functions at those values are actually solutions of the differential equation system.
- y = 0, u = 1
- Simulate this system with different values for the constants and the initial concentrations of nutrients and cells. The initial nutrient level can be =0, but the constants and the initial cell population size need to be positive. Can you make any observations about how the system behaves?
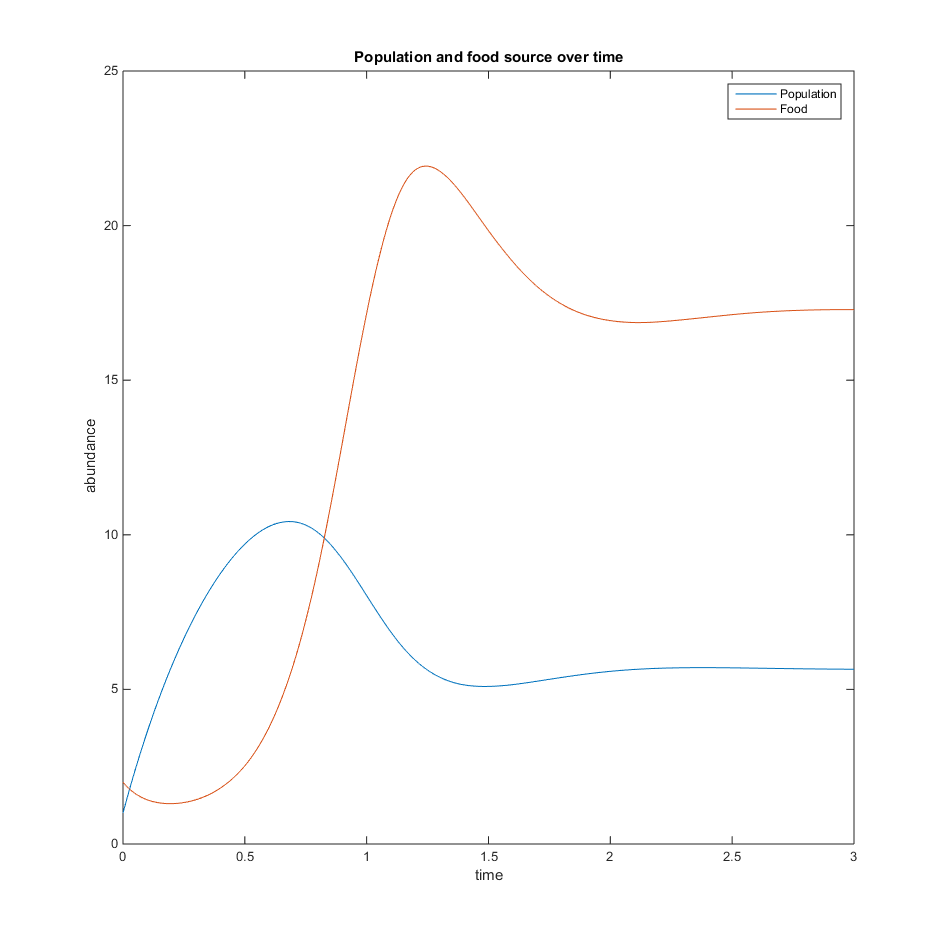
- In all of the plots below, the population increases as the amount of food decreases, and then levels out after a short period of time.
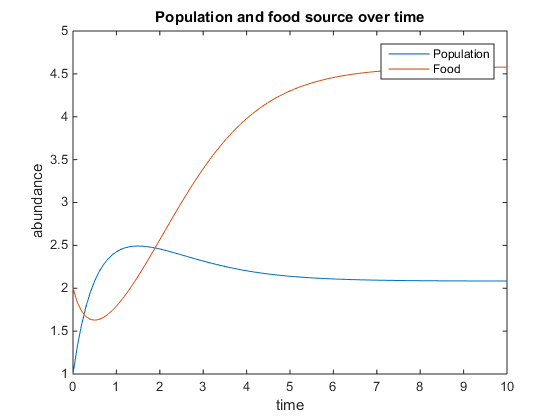
- Figure 1. The variables are Q=2, u=3, V=10, K=50, r=5
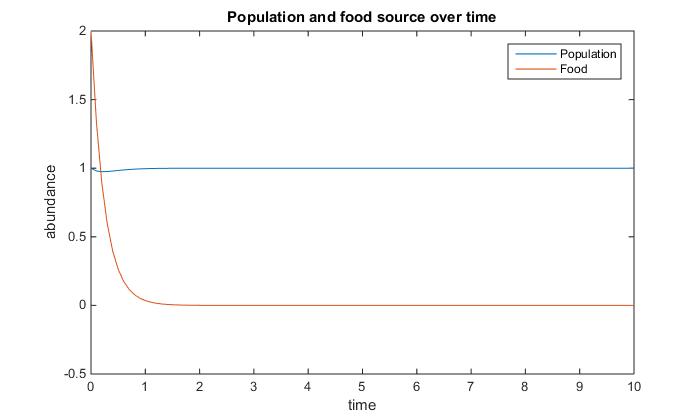
- Figure 2. The variables are Q=5, u=1, V=5, K=30, r=6
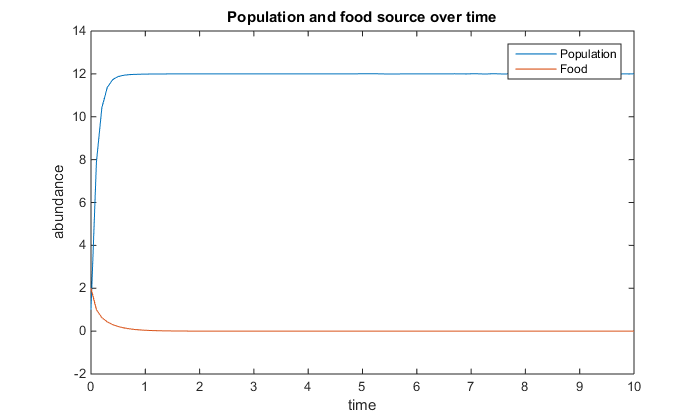
- Figure 3. The variables are Q=10, u=12, V=10, K=60, r=4
- What changes if we return a mortality term to the population equation? Repeat b and c for a linear mortality term.
- The system is at equilibrium at the same values.
- In the graphs below, the population showed a significant decrease due to the added linear mortality term.
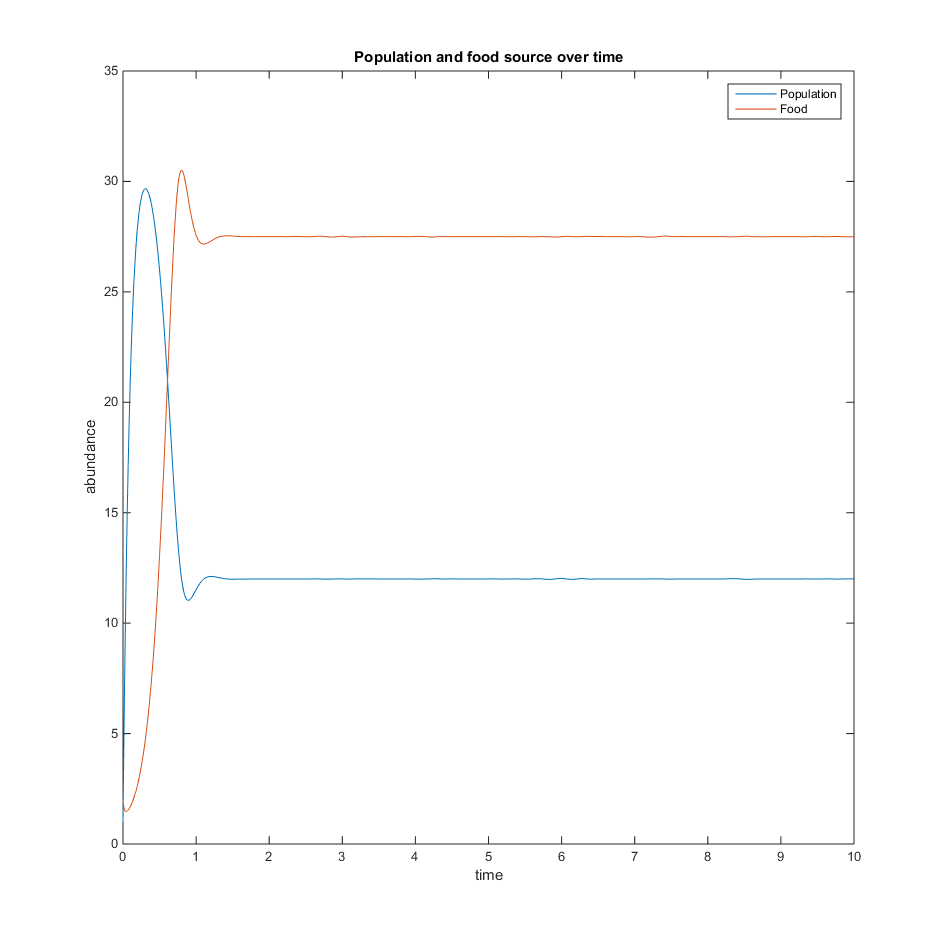
- Figure 4. The variables are Q=10, u=34, V=10, K=3, r=5 and d=30.
- Figure 5. The variables are Q=2, u=16, V=15, K=65, r=5, and d=4.
- Create a model with two nutrients, both of which are required for the population to grow.
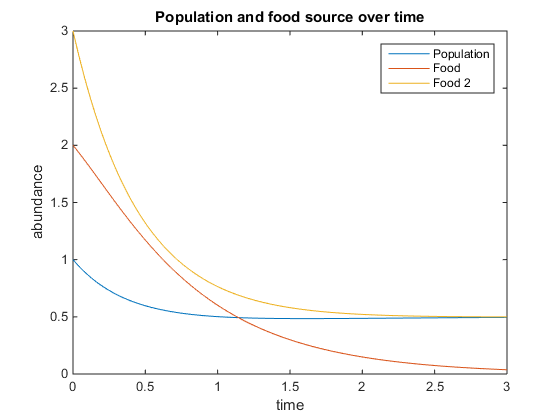
- Figure 6. The variables are Q=2, u=0.5, V=15, K=60, and r=5
Conclusion
I fulfilled the purpose of this assignment, which was to create and manipulate three different models of population growth and nutrients. One of the main findings of today's project was that in each of the scenarios, the population size and the amount of food available leveled out to a consistent rate. This is because the chemostat adds nutrients continuously at a fixed flow rate and concentration. The flow out of the chemostat is also set at a fixed rate. The amount of food was never at zero because more food is always being brought in. With an unlimited amount of food, the population is free to grow as much as it wants. The population decreased for a period of time when a linear mortality term was added, but both the population and the amount of food leveled out as time went on. When a second nutrient was added, both nutrients decreased as the population increased and then leveled out.
Acknowledgements
- I worked with Cameron M. Rehmani Seraji, Margaret J. O'Neil, Conor Keith, and Nika Vafadari in Seaver 120. We worked on the MATLAB script and function.
- I modeled the function and script off of what Dr.Fitzpatrick showed us how to do in class.
- Except for what is noted above, this individual journal entry was completed by me and not copied from another source.
Lauren M. Kelly 21:54, 8 February 2017 (EST)
References
Dahlquist, Kam D. (2017) BIOL398-05/S17:Week 4. Retrieved from http://www.openwetware.org/wiki/BIOL398-05/S17:Week_4 on 8 February 2017.
