The purpose of this lab was to gain familiarity navigating and using the NCBI database, PubMed, GenBank, and Biology Workbench websites and create an unrooted tree to visualize relationships between nucleic sequences.
Methods
Navigated to the NCBI website [www.ncbi.nlm.nih.gov |NCBI] and searched for the Markham article by typing in the full article title in quotations.
On the right side of the page I followed the "Nucleotide Sequence" link which took me to GenBank
I selected the first GenBank record and viewed in in full format and FASTA format
Navigated back to the previous nucleotide summary page and selected the first 5 sequences
In the top right corner I pressed "send to" and downloaded the 5 sequences into .FASTA, then opened the file using Microsoft Word
I navigated to the Biology Workbench website [workbench.sdsc.edu| Biology Workbench]
I created an account, then scrolled down until I saw the 5 tool sets, and followed the link for nucleic sequence data
I added the new sequences by uploading the file saved from GenBank
All sequences were selected and under "nucleic acid tools" I selected "ClustalW"
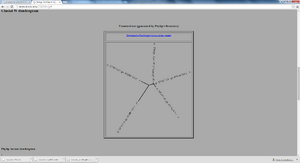
I selected "Run" and an unrooted tree diagram appeared
A new session was created to use in Activity 2
Results
Part II
The accession number of the sequence I chose from GenBank was: AF016767
The subject of the study that the HIV sequence was from was "Subject 1"
The section of the record that contained information about who the sample was taken from was under the heading "Definition"
The purpose of this lab was to take numerical, messy data and utilize programs such as BiologyWorkbench to build visual representations of relationships between nucleic sequences. An unrooted tree was formed successfully and I feel amply prepared for part II of this assignment. The shorter the sum of branches between two sequences on the tree, the more similar they are. Likewise if the branches that separate two sequences are very long, you can conclude they are not very closely related (respectively).
Markham, R. B., Wang, W.-C., Weisstein, A. E., Wang, Z., Munoz, A., Templeton, A., … Yu, X.-F. (1998). Patterns of HIV-1 evolution in individuals with differing rates of CD4 T cell decline. Proceedings of the National Academy of Sciences of the United States of America, 95(21), 12568–12573.
Seroconverting: The stage in an immune response when antibodies to the infecting agent are first detected in the bloodstream. For example, people infected with HIV typically seroconvert about 4–6 weeks following the initial infection, when antibodies against viral proteins are first produced.
Peripheral blood mononuclear cells (PBMC):A peripheral blood mononuclear cell (PBMC) is defined as any blood cell with a round nucleus (i.e. a lymphocyte, a monocyte, or a macrophage). These blood cells are a critical component in the immune system to fight infection and adapt to intruders.
Synonymous mutations (dS):Synonymous (or silent) mutation is when there is substitution of 1 base for another. However this type causes no change in the resultant protein because the codon encodes the same amino acid
Non-synonymous mutations (ND):Also know as "missense mutations", non-synonymous mutations cause base substitution resulting in a codon which encodes a different amino acid
Genetic diversity:Genetic diversity refers to both the vast numbers of different species as well as the diversity within a species. The greater the genetic diversity within a species, the greater that species' chances of long-term survival
Genetic divergence:The separation of a populations gene pool from the gene pools of other populations due to mutation, genetic drift, and selection. Continued divergence can lead to speciation
Epitopes: The structure on the surface of an antigen that is recognized by and can bind to a specific antibody. Its shape is generally complementary to that of the antibody's antigen-binding site.
Polymerase Chain Reaction (PCR): A technique used to replicate a fragment of DNA so as to produce many copies of a particular DNA sequence. PCR is commonly employed as an alternative to gene cloning as a means of amplifying genetic material for DNA sequencing.
15 participants in the study, all are injection drug users
All participants began study at the point of HIV-1 seroconversion
Three categories of disease progression were used:
Rapid progressors - after 2 years of seroconversion, these subjects had less than 200 CD4 T Cells
Moderate progressors - after 4 years of observation, these subjects had between 200-650 CD4 T Cells
Non-progressors - throughout all observation periods these subjects maintained greater than 650 CD4 T Cells
PCR was used to amplify a region of approximately 300 bp in subject's cells to sequence the genes
PCR sequences were cloned and sequenced. The sequences are available on GenBank.
Reverse transcription PCR was used to detect the viral load in plasma
Phylogenetic trees were created and different taxa were color coordinated according to the time when the sample was taken
Correlation analysis was determined by assigning pairs of visits within individuals and diversity, divergence, and CD4 T cells were tracked
Synonymous-Nonsynonymous ratios were computed (dS/dN) and averaged between all strains observed at one visit to remove potential biases
Subjects 9 and 15 were reexamined due to high variation to see if these subjects obtained two different viruses
Diversity and divergence were analyzed by creating a regression line and calculating slope and slope averages
Previous studies
Previous studies do exist but they were not as complete as this study..they involved too few people, not the right analysis, too short of an observation period, or not enough time points of observation; this study aimed to improve the accuracy and credibility of the same type of information
Viruses are generally homogenous at the beginning
Results
CD4 T Cell data and viral load data was only partially significant
CD4 T Cell counts demonstrated a decline in some patients, but an increase in others with a spread of -600/yr cells to +50 cells/yr
Nonprogressors generally had a lower viral load the data could not differentiate between rapid and moderate progressors
Sequencing was focused on a region known to tolerate mutations and be the site of viral-host interaction
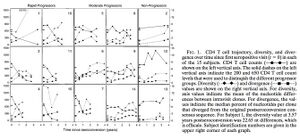
All groups demonstrated an increase in diversity and divergence; the greatest change was observed in the rapid progressors and the smallest change was observed in the nonprogressors
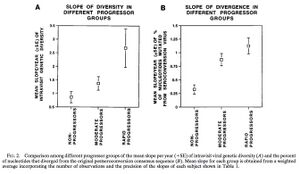
When comparing data nonprogessors provided a sort of baseline, slopes of rates of progression of other groups compared to baseline showed significance but not against each other
Patients who experienced an increase in diversity also showed a significant decrease in CD4 T Cell count over the following 12 months
Ratios were completed to compare synonymous mutations per site of potential synonymous mutations, as with nonsynonymous mutation and the rapid progressors and moderate progressors showed significant ratios deviating from 1 but nonprogressors only showed a trend towards significance
Ratios were used to determine selective advantages
Phylogenetic trees showed no observable dominant strain in majority of subjects which means the viruses were changing
Figures
Figure 1 Figure 1 graphically demonstrates relationships between diversity, divergence, and CD4 T Cell counts in all 15 subjects - generally an increased diversity and divergence was followed by a decrease in CD4 T Cell count
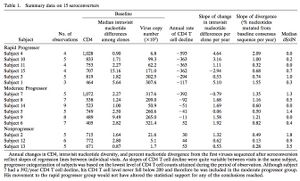
Table 1 Table 1 gives numerical data used in plotting figure 1 and in creating ratios between rapid progressor, moderate progressor, and nonprogressor data
Figure 2 Figure 2 plots the mean slopes of divergence and diversity against the three different progressor groups - nonprogressor mean was significantly lower than other groups in both diversity and divergence
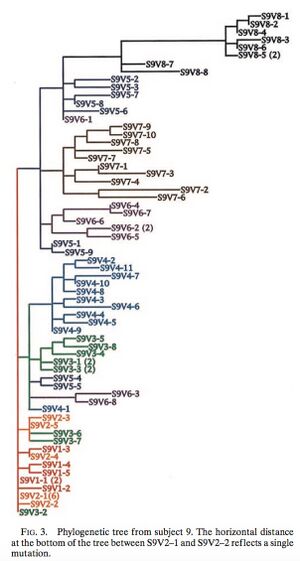
Figure 3 Figure 3 shows the phylogenetic tree of subject 9 - mutations
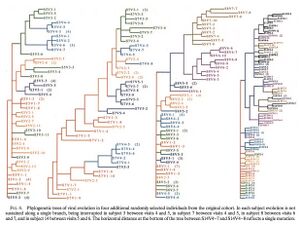
Figure 4 Figure 4 shows the disrupted evolutionary pattern of the virus
Extra questions
The significance of this work is to show that CD4 T Cell counts are inversely related to diversity and divergence of the HIV-1 virus, and to gain a better understanding of how the HIV-1 virus progresses and develops
Previous limitations of experients included not drawing enough samples, having too short of an observation period, or potential dual-infection of subjects. They resolved these limitations by increasing the observation period, increasing the number of samples taken, and performing analysis on viral loads to make sure each subject was effected by only 1 virus
The main results from this paper were the hypotheses that HIV-1 rapid progressor groups demonstrate a favoratism for nonsynonymous mutations, the development of the inverse relationship between CD4 T Cells and genetic diversity and divergence, and the production of phylogenetic trees to track the evolution of the virus throughout the observation period
In previous studies it was found that there was greater genetic divergence rapid progressors, however the diversity in the rapid progressors was less than the observed nonprogressors (McDonald et al.). There has historically been an inconsistent past relationship between CD4 T Cell count and genetic diversity and divergence; this paper supports a new hypothesis that supports this inverse relationship
These results support previous studies that said increasing genetic diversity and divergence is related to CD4 T Cell decline (Nowak)
The limitations of this study were that only 15 subjects were studied, in the future a more diverse random sample could help elucidate the relatinoships in question
Future work on this subject could include further research on why nonysnonymous mutations appear to be favored by the HIV-1 virus, followed by trying to understand how we might be able to prevent these harmful mutations in the future and eventually slow the progression of the disease
Acknowledgements
I received help on this assignment from my homework partner User: Isai Lopez on understanding figures and tracking data in Table 1 outside of class
While I recieved help on this assignment all work completed on this page is my own and was not copied from anyone else
Markham, R. B., Wang, W.-C., Weisstein, A. E., Wang, Z., Munoz, A., Templeton, A., … Yu, X.-F. (1998). Patterns of HIV-1 evolution in individuals with differing rates of CD4 T cell decline. Proceedings of the National Academy of Sciences of the United States of America, 95(21), 12568–12573.