Nicolette S. Harmon Week 3
From OpenWetWare
Jump to navigationJump to search
Activity 1
Methods
- I accessed the Markham et.al paper on PubMed in order to find the HIV sequences that are stored in GenBank.
- I selected the sequence labeled GenBank/AFO16772, this sequence was then formatted using FASTA.
- This newly formatted sequence was then saved on Workbench.
- I repeated steps 2 and 3 with the sequences GenBank/AFO16782 and GenBank/AFO16762.
- Using the ClustalW tool on Workbench, I ran a multiple sequence alignment using the GenBank/AFO16772, GenBank/AFO16782, and Genbank/AFO16762 sequences.
- I recorded the scores for these sequences in the Results section.
Results
- When I ran the ClustalW tool on workbench for all 3 sequences the overall score was 5250.
- The program then reported the score for the GenBank/AFO16782 and GenBank/AFO16762 sequences as 99.
- The score for GenBank/AFO16772 and GenBank/AFO16782 was 96.
- The score for GenBank/AFO16772 and GenBank/AFO16762 was 96.
Activity 2
Methods
- I uploaded the "Visit_1_Subjects_1_thru_9_HIV.txt" and the "Visit_1_Subjects_10_thru_15_HIV.txt" files onto Workbench.
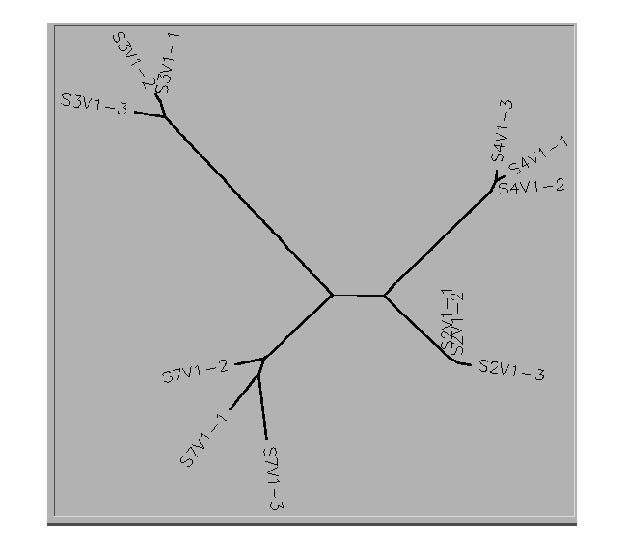
- I ran a multiple sequence alignment using the ClustalW tool for Subjects 2,3,4,7 using the first 3 clones from each subject.
- The unrooted tree for these sequences is recorded in the Results section.
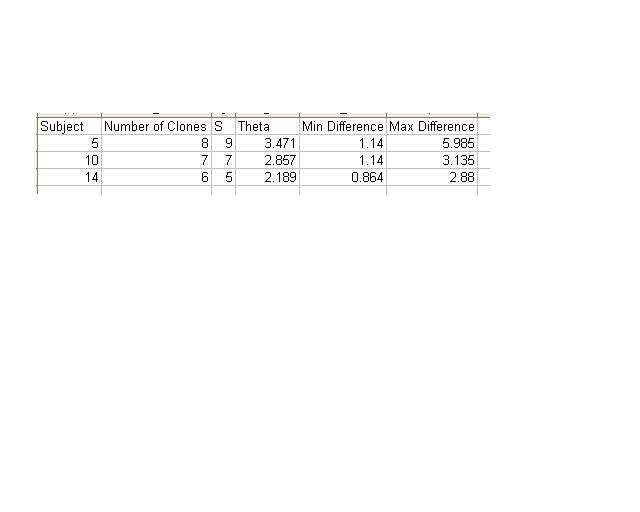
- Next, I aligned all of the clones for Subject 14 so that I could calculate the number of non-identical positions in each sequence.
- The ClustDist tool was accessed to determine the minimum and maximum differences in sequence for Subject 14.
- Steps 4 and 5 were repeated for Subjects 5 and 10.
- The table used to record this information for these three subjects is below.
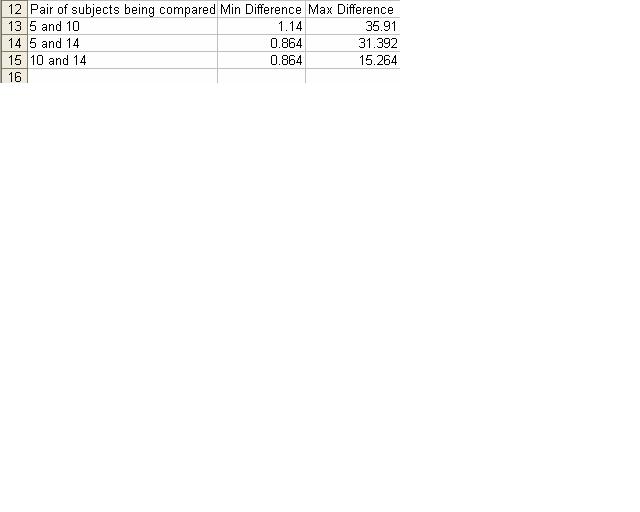
- ClustDist was then used to compare the different combinations of pairing for these sequences.
Results
- This is the unrooted tree diagram for Subjects 2,3,4,7.
- These results for the table below were calculated using the multiple alignment tool on Workbench.
- The results in the table below were calculated by using the multiple alignment tool for each pairing possible.
Questions
Activity 1 Part 2
- The accession number of the sequence I chose was AFO16772.
- The HIV sequence I used came from Subject 1.
Activity 2 Part 1
- The clones from Subjects 2 and 4 were clustered together.
- 2 of the 3 clones selected for Subject 3 were clustered while the third clone was somewhat isolated. All of the clones selected from Subject 7 were more diverse.
- Subjects 2 and 4 were somewhat clustered together with Subject 7 being a little further away. Subject 3 was the most diverse of the subjects.
Lists of Terms for Week 4
- Intravenous- into or within a vein. National Cancer Institute September 20 2011
- Epidemiology- study of causes, patterns, and control of disease in groups. National Cancer Institute September 20 2011
- Cohort- a group of organisms that are apart of the same species that are studied over a period of time. Biology Online September 20 2011
- Seroconversion- the change of a serologic test from negative to postive, indicating the development of antibodies in response to an infection or immunisation. Biology Online September 20 2011
- Divergence- spreading apart in different directions. Biology Online September 20 2011
- Epitope- a site on a large molecule in which and an antibody will be produced and bound to. Biology Online September 20 2011
- Phylogenetic- of or relating to the race history of an organism. Biology Online September 20 2011
- CD4- a glycoprotein that serves as a differentiation antigen found on the surface of T lymphocytes and macrophages. Biology Online September 20 2011
- Plasma Viral Load- the number of viral particles in a sample of blood plasma. Biology Online September 20 2011
- Taxon- any group or rank in a biological classification into which related organisms are classified. Biology Online September 20 2011
Outline for Markham Paper
Abstract
- 15 subjects with HIV were studied to see determine the decline of CD4 T cells
- Nonsynonymous mutations were selectively favored in progressors while they were selected against in nonprogressors
- The subjects had different types of mutations that were likely due to different environments of each host
- The subjects in this experiment were brought in at different intervals over the course of four year
- The purpose of this experiment is to show that increased rates in genetics diversity is linked to rapid decreasing rates of CD4 T cells
Methods
- The subjects in this study were brought in every 6 months so data could be collected
- Rapid progressors= <200 CD4 T cells in a two year period
- Moderate progressors= 200-650 CD4 T cells in 4 years
- Nonprogressors= >650 CD4 T cells throughout the entire observation period
- PCR was used to look at base pair sequences in the subject's blood cells in order to compare them to the RNA of the virus
- 35 cycles of PCR were done and samples were held at 72degrees for 10 minutes
- The sequences from the PCR were cloned and then sequenced using the Sanger chain termination method
- Most of the clones were shown to be derived from a diverse viral genome template
- Reverse transcription was used to determine the number of viral particles in a blood plasma sample
- Taxon labels were assigned based on times that the subjects came in for their visit, although some data is lacking on visits of some subjects
- The taxa were colored to correspond with the time that they were observed
- Phylogenetic trees determined independent segregation of clones except subject 1 and 2
- 76 time points, 15 subjects in 1 year is the correlation analysis
- Each subject's sequence was compared to an observed strain
- Mutations were either synonymous or nonsynonymous
- Numbers were adjusted based on mutation class that occurred to eliminate bias towards nonsynonymous
- Since values had a skewed distribution, average values were adjusted to the median values
- Subjects 9 and 15 displayed high genetic variation at their first visit
- Phylogenetic trees were constructed and subjects were determined to have monophyletic viruses
- These subjects were seronegative up to 7 months before their first visit
- To compare rate, a regression line of divergence/diversity was placed over time
- The slopes for each of the three groups was compared
Results
- The median annual changes in CD4 T cells ranged from +53 to -593 per year
- Nonprogressors had a low viral load that was distinguishable from moderate and rapid
- Rapid and moderate viral loads were non-distinguishable
- A total of 873 clones were sequenced and analyzed
- Changes in HIV sequences were quantified by: genetic diversity per visit and divergence per visit
- The rate of change in median diversity ranged from -2.94 to 5.10 nucleotides per clone
- Initial visit: subjects 9 and 15 displayed heterogeneity while all others displayed homogeneity
- Diversity and divergence increased over time in all three categories
- The increasing rates were greater in the more progressive categories
Links
BIOL368/F11:Class Journal Week 1
BIOL368/F11:Class Journal Week 2
BIOL368/F11:Class Journal Week 3
BIOL368/F11:Class Journal Week 4
BIOL368/F11:Class Journal Week 5
BIOL368/F11:Class Journal Week 6
BIOL368/F11:Class Journal Week 7
BIOL368/F11:Class Journal Week 8
BIOL368/F11:Class Journal Week 9
BIOL368/F11:Class Journal Week 10
BIOL368/F11:Class Journal Week 11
BIOL368/F11:Class Journal Week 12


