Nicolette S. Harmon Week 10
From OpenWetWare
Jump to navigationJump to search
HIV Structure Redux
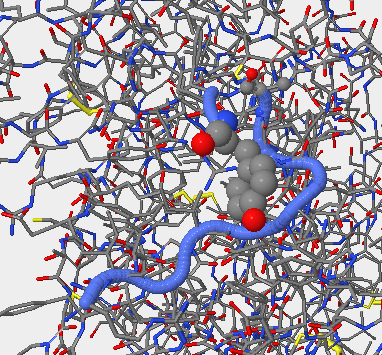
- The image on the left shows the V3 loop region colored in blue, the amino acid ALA at position 323 is shown. The image on the right also shows the V3 loop region colored in blue, the amino acid PHE at position 324 is shown. These structures were taken from Stanfield 1F58. There is a mutation in these two amino acids in Subject 8 on the 7th visit, it should also be noted that this subject was considered to be a moderate progressor by Markham. This is not overly surprising because this was the last visit for the subject. Instead of having ALA at position 323, this subject had VAL and instead of having PHE at position 324, this subject had TYR.
- Both of these mutation are on the surface of the protein.
Discovery Questions from Chapter 4
- For Hour 1, all of the genes are expressed at a ratio of 1.0 which means that they are all yellow, no change in transcription. For Hour 3, gene X has a ratio of 2.2 which means it would be red, gene Y has a ratio of 4.5 which means it would also be red , and gene Z has a ratio of 1.5 which means it would be red. For Hour 5, gene X has a ratio of 2.2 which indicates red, gene Y has a ratio is 0.95 which indicates green, and gene Z has a ratio of 2.0 which indicates red. For Hour 9, gene X has a ratio of 0.15 which indicates green, gene Y has a ratio of 0.05 which indicates green, and gene Z has a ratio of 2.0 which indicates red.
- Genes X and Y are transcribed similarly, during the Hours 1 and 3 they both undergo no change and then induction. For Hour 5, gene X undergoes no change and gene Y is repressed. For Hour 9, both genes are repressed.
- Most spots would be yellow at the first time point because the mRNA would not have been transcribed yet.
- TEF4 showed no change for the first portion but then it turned a brighter green indicated it was being repressed, this could be to conserve glucose.
- The TCA cycle would be induced if glucose was running out because it has two proteins that can control the irreversible steps in glycolysis. This would cause the reversal of the flow of carbon toward glucose-6-phosphate. Trehalose Synthase and Glycogen Synthase would also be induced and the function by converting glucose-6-phosphate into storage sugars.
- The genes could all respond to changing conditions or unknown genes can take on the functions of known genes.
- The DNA chip would be the color red.
- The overexpressed transcription factor Yap1p would be the color red.
- Yes, the expression of one gene may be dependent on the expression of another gene. It's possible that one gene could only be expressed in the absence of another gene, also the product of the latter gene could repress the former gene.
- Control spots should not be affected by repressors and other transcription factors. The microarray data would show a deletion of overexpression.
Links
BIOL368/F11:Class Journal Week 1
BIOL368/F11:Class Journal Week 2
BIOL368/F11:Class Journal Week 3
BIOL368/F11:Class Journal Week 4
BIOL368/F11:Class Journal Week 5
BIOL368/F11:Class Journal Week 6
BIOL368/F11:Class Journal Week 7
BIOL368/F11:Class Journal Week 8
BIOL368/F11:Class Journal Week 9
BIOL368/F11:Class Journal Week 10
BIOL368/F11:Class Journal Week 11
BIOL368/F11:Class Journal Week 12

