Kristen M. Horstmann Week 9 Journal
From OpenWetWare
Jump to navigationJump to search
Chp 4 Responses
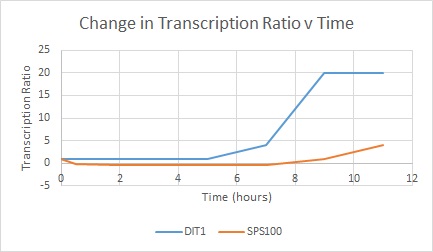
- Choose two genes from Figure 4.6b (PDF of figures on MyLMUConnect) and draw a graph to represent the change in transcription over time. You can either create your plot in Excel and put the image up on your wiki page or you can do it in hard copy and turn it in in class.
- Look at Figure 4.7, which depicts the loss of oxygen over time and the transcriptional response of three genes. These data are the ratios of transcription for genes X, Y, and Z during the depletion of oxygen. Using the color scale from Figure 4.6, determine the color for each ratio in Figure 4.7b. (Use the nomenclature "bright green", "medium green", "dim green", "black", "dim red", "medium red", or "bright red" for your answers.)
- Gene X
- Hour 1: Black
- Hour 3: Dim Red
- Hour 5: Black
- Hour 9: Medium Green
- Gene Y
- Hour 1: Black
- Hour 3: Bright Red
- Hour 5: Dim Green
- Hour 9: Bright Green
- Gene Z
- Hour 1: Black
- Hour 3: Dim Red
- Hour 5: Dim Red
- Hour 9: Dim Red
- Gene X
- Were any of the genes in Figure 4.7b transcribed similarly? If so, which ones were transcribed similarly to which ones?
- Genes X and Y were transcribed similarly as their ratios were closer to each other than Z's. Both X and Y spiked up in transcription at first (around 3 hours) then decreased rapidly until the final ratio (hour 9) was much lower than the intial ratio.
- Why would most spots be yellow at the first time point? I.e., what is the technical reason that spots show up as yellow - where does the yellow color come from? And, what would be the biological reason that the experiment resulted in most spots being yellow?
- I would assume that at first, many genes appear yellow because the cell is taking time to adapt to the environment and/or the fluorescent dye added. The yellow color comes from the combination of control (green) and experimental (red) levels. When these are expressed relatively evenly, the cell chip will appear yellow.
- Go to the Saccharomyces Genome Database and search for the gene TEF4; you will see it is involved in translation. Look at the time point labeled OD 3.7 in Figure 4.12, and find the TEF4 spot. Over the course of this experiment, was TEF4 induced or repressed? Hypothesize why TEF4’s change in expression was part of the cell’s response to a reduction in available glucose (i.e., the only available food).
- Due to glucose decreasing, TEF4 was repressed in this experiment. This is shown in the microarray as the TEF4 chip changed from yellow to green (more control than TEF4) as time progressed. As the cell's food source was decreasing, the TEF4 function will be repressed as it has no glucose or ethanol to work off of. It also may be repressed in order to save energy as there is a limited and valuable food source.
- Why would TCA cycle genes be induced if the glucose supply is running out?
- The TCA cycle helps the cell exactly in this type of emergency scenario. This cycle can help the cell produce energy from carbon compounds other than glucose, like ethanol. The cycle is "turned on" when glucose is decreased and will still be able to make ATP in order for the cell to reproduce and survive.
- What mechanism could the genome use to ensure genes for enzymes in a common pathway are induced or repressed simultaneously?
- The genome could have genes within the same general area where they have a similar repressor switch so that it is able to easure the environmental conditions so it can regulate which genes are being produced.
- Consider a microarray experiment where cells deleted for the repressor TUP1 were subjected to the same experiment of a timecourse of glucose depletion where cells at t0 (plenty of glucose available) are labeled green and cells at later timepoints (glucose depleted) are labeled red. What color would you expect the spots that represented glucose-repressed genes to be in the later time points of this experiment?
- I would assume there are more red spots after the experiment was completed. This is because the cells would need to compensate for the loss of TUP1 as TUP1 typically represses these glucose-dependent genes.
- Consider a microarray experiment where cells that overexpress the transcription factor Yap1p were subjected to the same experiment of a timecourse of glucose depletion where cells at t0 (plenty of glucose available) are labeled green and cells at later timepoints (glucose depleted) are labeled red. What color would you expect the spots that represented Yap1p target genes to be in the later time points of this experiment?
- I would expect mostly red spots as YAP1P will be increased due to the decrease in glucose. Yap1p is increased when there is some sort of environmental stress on the cell, and a decrease in glucose would definitely count as a stresser. Therefore, yap1p will be increased over time to accommodate this stress.
- Using the microarray data, how could you verify that you had truly deleted TUP1 or overexpressed YAP1 in the experiments described in questions 8 and 9?
- Verification of deletion of TUP1 would be by examining the microarray data. If the circle where TUP1 was expressed was black, it would have been successfully deleted. If YAP1 was over expressed, this would be confirmed by a bright red color in its respective chip.
Back to User: User: Kristen M. Horstmann
- Week 1
- Week 2
- Week 3
- Week 4
- Week 5
- Week 6
- Week 7
- Week 8
- Week 9
- Week 10
- Week 11
- Week 12
- Week 13
- Week 14
- Week 15
