Yaniv Maddahi Journal Week 1
From OpenWetWare
Jump to navigationJump to search
Objectives
- The objectives of this exercise are to interact with models and to discover new ways in which models can be used and implemented in an academic environment.
Questions after watching the video “The role of applied math in real-time pandemic response: How basic disease models work”
- If the area under the curve is the same whether it is a sharp peak or flattened curve, why flatten the curve in the first place? Aren’t the same amount of people getting sick either way?
- How do the equations account for external factors/variables?
SIR Model
- What happens if initial I = 0?
- All people are susceptible to being infected, there are no deaths, and none recovered because no one has been infected.
- What does it mean that the red line increases so rapidly?
- The red line is increasing rapidly because all susceptible people are becoming infected and are doing so at a greater rate than recovery however reaches a maximum and then drops back down once more people are recovering than infected.
- What does it mean that the green line also rises rapidly, but not as rapidly?
- It means that the number of people recovering is steadily increasing but not as rapidly as the amount of people getting infected.
- What does it mean that the green line reaches nearly to 1,000?
- It means that nearly everyone has recovered but not exactly everyone. Almost all of the initial population has recovered.
Epidemix Graph Exercise
Starting Graph
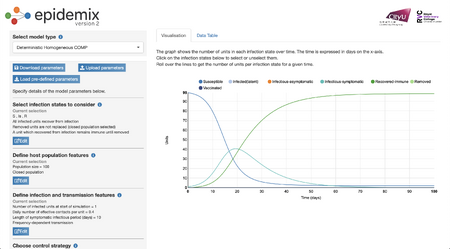
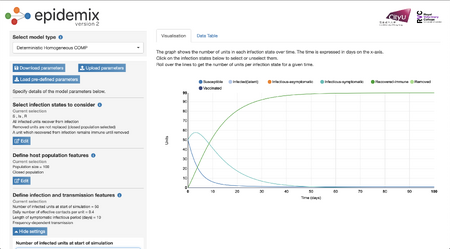
- I chose a "Domestic Homogenous COMP" graph. I chose this because the graph seemed to have the smoothest curves out of all and is a single graph.
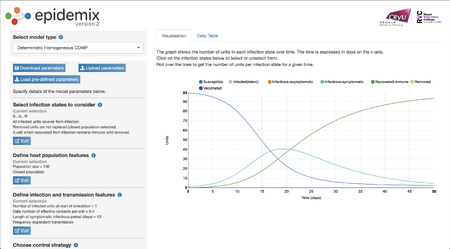
- The graph is depicting the spread of an infection among a population of 100 people.
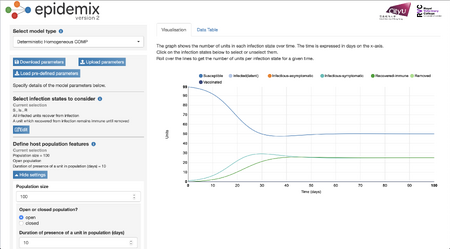
Graph 1
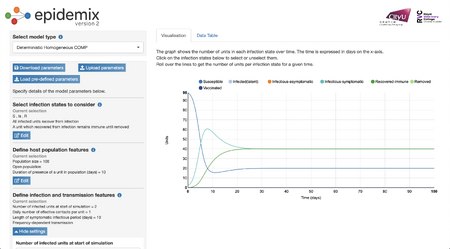
- By changing the population to an open one and setting a cap on the duration for which an individual will remain in the given population (10 days), there seems to be a platues for the amount of people getting infected. The number of susceptible individuals platues as well. Ultimately, not all individuals get infected.
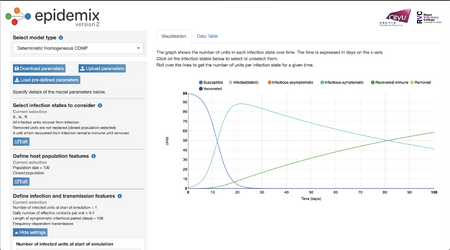
Graph 2
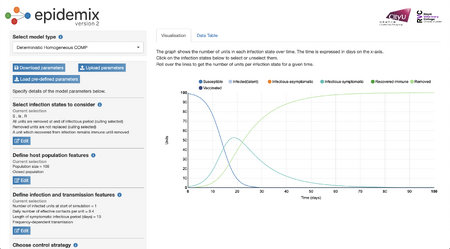
- By changing the length of symptomatic infectious period in days from 10 to 100, there seems to be a drastic change in the number of infectious-symptomatic units as well as a decrease in the rate of recovery.
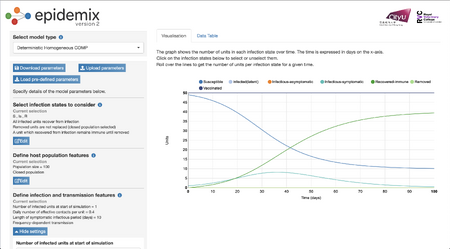
Graph 3
- By adding a control strategy of vaccination and 0.5 proportion of vaccinated units, there seems to be a slower rate of susceptibility of people to infection as well as a decrease in the number of infectious-symptomatic units. There seems to also be an asymptotic feature of both the recovered-immune and susceptible units.
Graph 4
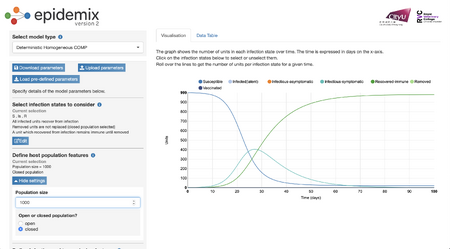
- By increasing the size of the population to 1000, there since to be a rightward shift in the duration to reach the same circumstances of the initial graph. None of the specific parameters other than time seemed to be affected.
Graph 5
- By reducing the duration of the infection to only 50 days, there seems to be a more gradual change in the parameters than before. There is a gradual increase in both the infection rate as well as recovery as well as a gradual decrease in number of susceptible units.
Graph 6
- By adding a control strategy of culling, there seems to be an increase in the number of infectious-symptomatic individuals. There are also no recovered-immune individuals and only "removed" individuals.
Graph 7
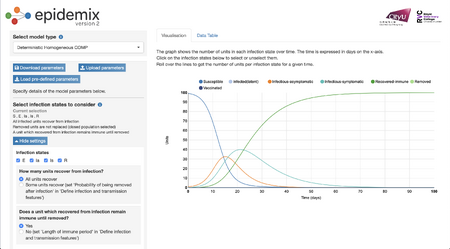
- By adding more infection states to the parameters of the simulation, a new category of "infectious-asymptomatic" has been added to the graph.There is also a steeper decline in the number of susceptible units in the population.
Graph 8
- By adding an initial infected value of 50 (half the population), the maximum value of infectious-symptomatic individuals reaches its maximum value almost immediately.
Graph 9
- By changing the population to open, increasing the frequency of effective transmission contacts to 1, and having an initial 2 infected individuals, the number of infectious-symptomatic individuals platues at a lower value and the number of susceptible individuals platues at a higher number. Thus, with the changes made, there seems to be an equilibrium that is met sooner and with a number of individuals who will remain infectious and susceptible.
Graph 10
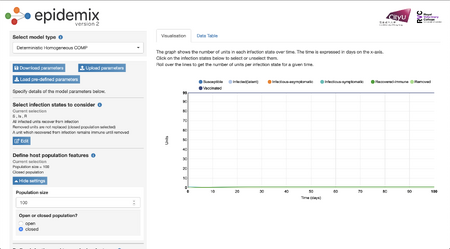
- By adding a control strategy of vaccination although now having the proportion of vaccinated units equal to 1, it seems that there will be a constant state of all individuals being susceptible although none being infectious.
Modelling the COVID-19 epidemic and implementation of population-wide interventions in Italy
- How did the authors modify the simple SIR model to take into account features of the COVID-19 pandemic?
- Most importantly this model includes individuals who died compared to the original SIR model that only included recovery and excluded death. There seem to be a lot more stages of illness among individuals along with different categories. For example, the model expands on the category of "infected" by including an individual who may be ailing, diagnosed, or recognized.
- What public health policy implications does their model have?
- This model places a strong important on testing. If individuals who are infect but asymptomatic and undiagnosed are to be able to interact with at risk citizens, the virus itself will only continue to spread. It is testing of all individuals that will allow those who are infected to be diagnosed and then placed in isolation. It also implies the importance of proactive defense; wearing face masks and keeping distances between individuals.
Funny Comic
- Why is the comic funny?
- The comic is funny because it is exaggerating/emphasizing the stigmatism that STEM majors do not have social lives and thus cannot accurately predict patterns of socialization for creating accurate models of, in this case, infection.
Conclusion
- The objectives were met in that different models were made through manipulation and the different ways in which models can be used according to different scenarios were explored.
Template
Assignment Week
- Week 1 Assignment
- Week 2 Assignment
- Week 3 Assignment
- Week 4 Assignment
- Week 5 Assignment
- Week 6 Assignment
- Week 7 Assignment
- Week 8 Assignment
- Week 9 Assignment
- Week 10 Assignment
- Week 11 Assignment
- Week 12 Assignment
- Week 14 Assignment
Individual Journal Pages
- Yaniv Maddahi Journal Week 1
- Yaniv Maddahi Journal Week 2
- Yaniv Maddahi Journal Week 3
- Yaniv Maddahi Journal Week 4
- Yaniv Maddahi Journal Week 5
- Yaniv Maddahi Journal Week 6
- Yaniv Maddahi Journal Week 7
- Allosteric Database Review
- Yaniv Maddahi Journal Week 9
- Yaniv Maddahi Journal Week 10
- Yaniv Maddahi Journal Week 11
- The Mutants Research Project Week 12
- The Mutants Research Project Week 14
Class Journal Pages
- Class Journal Week 1
- Class Journal Week 2
- Class Journal Week 3
- Class Journal Week 4
- Class Journal Week 5
- Class Journal Week 6
- Class Journal Week 7
- Class Journal Week 8
- Class Journal Week 9
- Class Journal Week 10
- Class Journal Week 11
- Class Journal Week 12
- Class Journal Week 14
Acknowledgements
- I acknowledge my TA, Annika Dinulos,who I contacted regarding a question for one of the models.
- I copied and modified the protocol shown on the Week 1 page.
- I retrieved images for my graphs from the Epidemix website
"Except for what is noted above, this individual journal entry was completed by me and not copied from another source." Yaniv Maddahi (talk) 16:59, 17 September 2020 (PDT)
References
- OpenWetWare. (2020). BIOL368/F20:Week 1. Retrieved September 3, 2020, from https://openwetware.org/wiki/BIOL368/F20:Week_1
- OPenWetWare. (2020). BIOL368/F20:Week 2. Retrived September 12, 2020, from https://openwetware.org/wiki/BIOL368/F20:Week_2
- Epidemix. (2020). Retrived September 12, 2020, from https://www.epidemix.app
