Tessa A. Morris Week 9
From OpenWetWare
Jump to navigationJump to search

-
- Gene X
- Hour 1: Black
- Hour 3: Medium red
- Hour 5: Black
- Hour 9: Medium green
- Gene Y
- Hour 1: Black
- Hour 3: Bright Red
- Hour 5: Dim green
- Hour 9: Bright green
- Gene Z
- Hour 1: Black
- Hour 3: Dim red
- Hour 5: Medium red
- Hour 9: Medium red
- Gene X
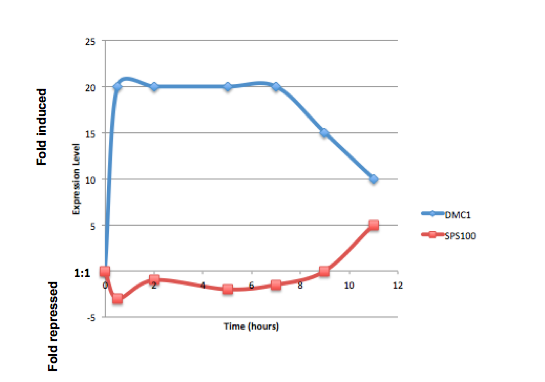
- Genes X & Y were transcribed similarly. They followed the same pattern, going from black to red to green.
- Most spots would be yellow at the first time point, because there is an overlap between the green (fold induced) and red (fold repressed), which appear yellow. The biological reason that most spots appeared yellow is because there are an equal number of genes being induced and repressed.
- Over the course of the experiment, the gene TEF4 was repressed. TEF4's change in expression was part of the cell's response to a reduction in available glucose because the repression of TEF4 decreases the rate of translation, meaning there will be less protein produced and less glucose being used up.
- The TCA cycle genes would be induced if the glucose supply is running out because the TCA cycle utilized molecules other than glucose as an energy source.
- To ensure that genes for enzymes in a common pathway are induced or repressed simultaneously, use the "guilt by association theory" explained here. The genes that have functions that are similar will be induced or repressed by the same promoter.
- The spots that represent glucose-repressed genes will be red (induced) at the later time points of the experiment.
- The spots that represented YAP1 target genes will be red (induced).
- If you have truly deleted TUP1, it should appear black because there is no gene there. If YAP1 is overexpressed, it should appear bright red, because there is a >20 fold induced.
Biomathematical Modeling Navigation
User Page: Tessa A. Morris
Course Page: Biomathematical Modeling
- Week 1
- Week 2
- Week 3
- Week 4
- Week 5
- Week 6: No Assignment
- Week 7
- Week 8: No Assignment
- Week 9
- Week 10
- Week 11
- Week 12
- Week 13
- Week 14
- Week 15