Tessa A. Morris Week 3
From OpenWetWare
Jump to navigationJump to search
Part I
Vector u plotted against Vector v
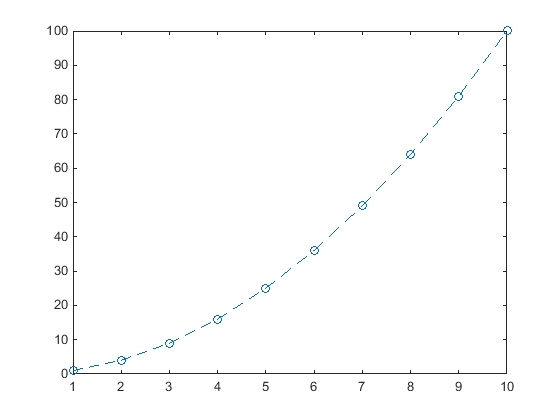
Figure 1 (above) displays the plot of vector v versus vector u.
Part II
Part III
Nutrient/Colony Plot

Figure 2 (above) is the plot of time versus state for the nutrient/colony model.
Chemostat Plot

Figure 3 (above) is the plot of time versus state for the chemostat model.
Chemostat Halved Plot

Figure 4 (above) shows the plot of time versus state for the chemostat model without being altered and the chemostat with the dilution adjusted. In this plot, run 2 signifies the run where the dilution (q) was reduced from 0.15 to 0.075.
Biomathematical Modeling Navigation
User Page: Tessa A. Morris
Course Page: Biomathematical Modeling
- Week 1
- Week 2
- Week 3
- Week 4
- Week 5
- Week 6: No Assignment
- Week 7
- Week 8: No Assignment
- Week 9
- Week 10
- Week 11
- Week 12
- Week 13
- Week 14
- Week 15
