Tessa A. Morris Week 7
Presentation
Matlab
Function
Script

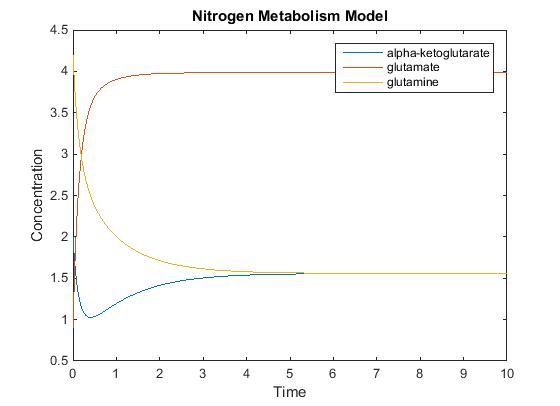
Original plot with all rate constants set to zero

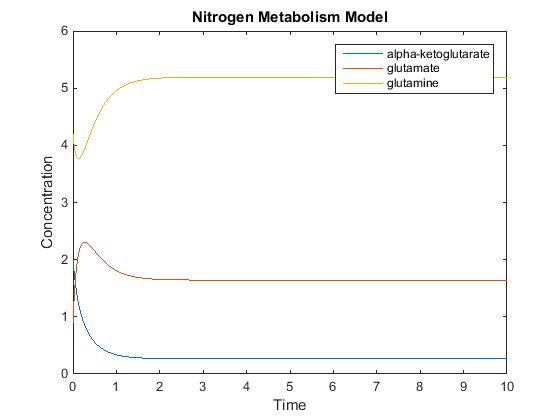
Plot with the second rate constant set to 4.

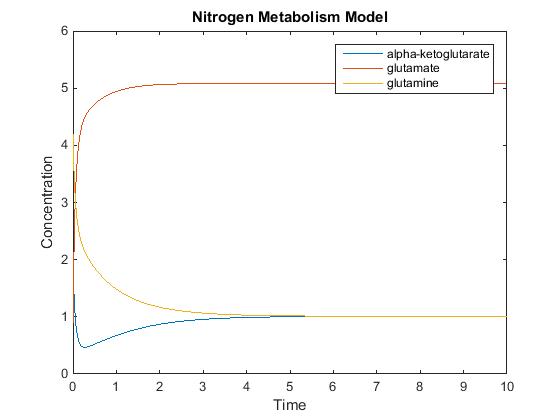
Plot with the third rate constant set to 4.
Lab Notes
On February 26, 2015, Alyssa and I paired up for the project. We started by creating the model for the system of equations provided by Dr. Fitzpatrick. We used a previous Matlab Script and Function from the chemostat model we did in the previous weeks. We used different values for the rate constants and plotted them to compare them against a model which had every rate set to 1. Once we modified the Matlab Script and Function, we created a GoogleDoc Presentation. On March 2nd we finished the powerpoint presentation. Alyssa and I worked on the project together, with Alyssa took the lead on the presentation, where I focused mainly on the matlab.
Biomathematical Modeling Navigation
User Page: Tessa A. Morris
Course Page: Biomathematical Modeling
- Week 1
- Week 2
- Week 3
- Week 4
- Week 5
- Week 6: No Assignment
- Week 7
- Week 8: No Assignment
- Week 9
- Week 10
- Week 11
- Week 12
- Week 13
- Week 14
- Week 15