Nika Vafadari Week 4
Electronic Lab Notebook Week 4
Purpose
To create a chemostat model of the growth of yeast and nutrient concentrations using Matlab and analyze the changes in concentrations when the parameter variables and initial conditions are altered.
Work Flow and Methods
Question 1
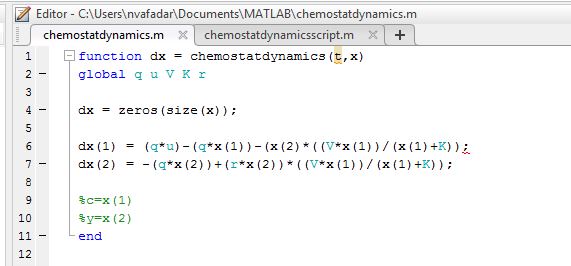
- First created the functions on Matlab using the two equations from the Week 4 Exercise handout
- titled the function chemostatdynamics
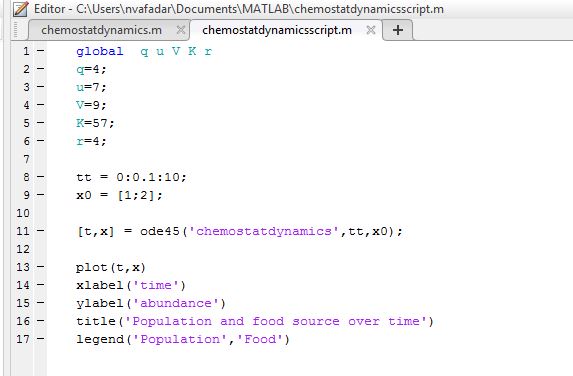
- Next created a corresponding script in order to graph the function
- After changed values of the variables (q, u, r, V, K) as well as the initial conditions in order to see how the plot of the population changed and find the values of c and y that allow the system to be equilibrium
Question 2
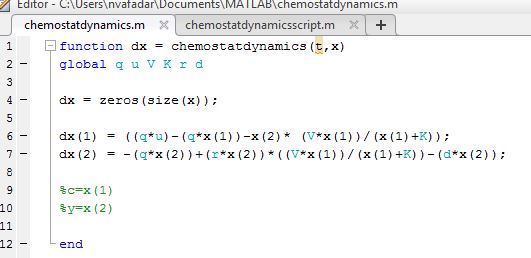
- First I edited the function to add a term/variable (death rate) for linear mortality
- Next the corresponding script was edited to include the new variable/parameter (d) by adding it to the global variables then setting d equal to a number.
- The function was then plotted, changing the values of the variables once again, specifically looking at the effect of changes in the value of d on the plot.
- Once again values were found for c and y that allow the system to be equilibrium
Question 3
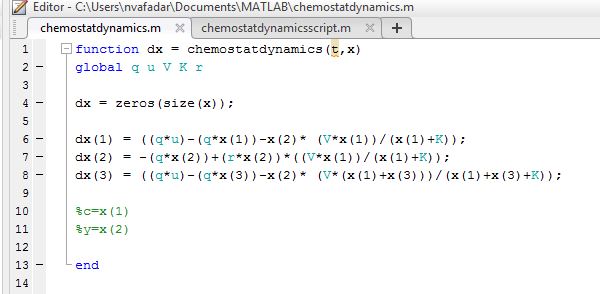
- First the previous function for linear mortality was edited, removing the mortality term and instead adding a third equation to account for the second nutrient
- The script was then adjusted to add a third initial condition, by expanding from x0=[1;3]; to x0=[1;3;2];
- The function containing the two nutrients was then plotted
Results
- Question 1
- a)
- state variables:
- y=concentration of yeast cells
- c=concentration of nutrients
- parameters: q, u, r, K, V
- b) Find values of c and y that hold the system in equilibrium
- y=0 and c=u
- c) Simulate this system with different values for the constants and the initial concentrations of nutrients and cells. Make any observations about how the system behaves.
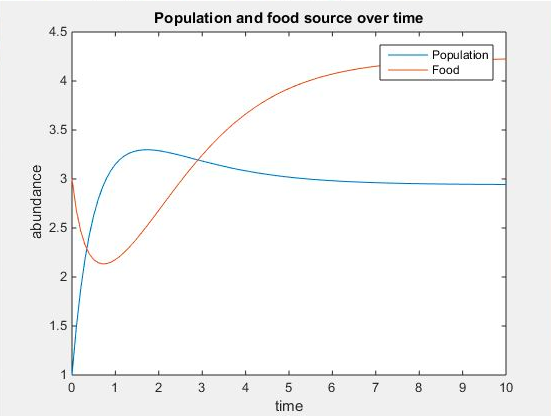
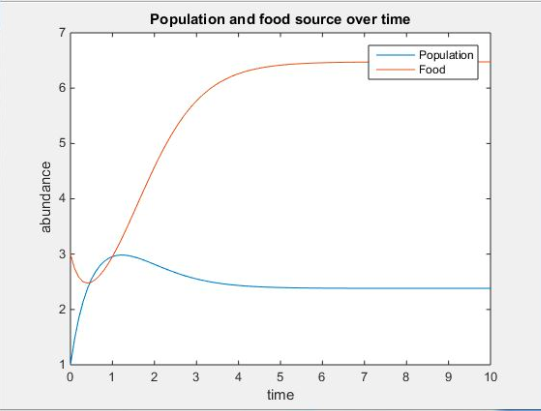
- Found below are two examples of the plots created during the simulations
- Figure 1. The figure above displays the concentration of yeast cells and nutrients over time at q=2, u=4, V=9, K=50, r=4 at the initial starting conditions of x0=[1;3] with t at intervals of 0.1 from 0 to 10.
- Figure 2. The figure above displays the concentration of yeast cells and nutrients over time at q=2, u=4, V=11, K=50, r=4 at the initial starting conditions of x0=[1;3] with t at intervals of 0.1 from 0 to 10.
- Observations:
- The two figures above display that the lower the value of V, the closer the concentrations of the nutrients and yeast are to each other.
- Both display that a change in concentration of both the nutrients and yeast from initial conditions takes place followed by a leveling off of the concentrations.
- As the concentration of nutrients decreases, the concentration of the yeast increases. Eventually both concentrations level off.
- Question 2: What changes if we return a mortality term to the population equation? Repeat b and c for a linear mortality term.
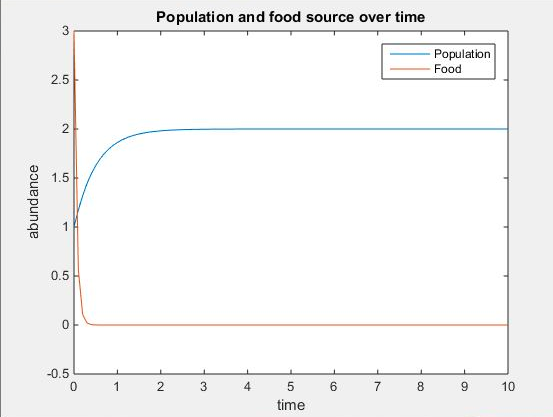
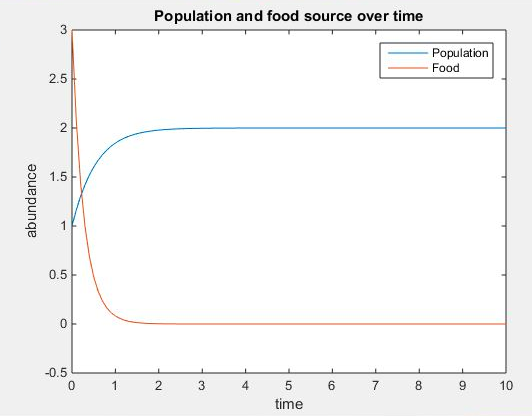
- Found below are two examples of the plots created during the simulations for linear mortality
- Figure 3. The figure above displays the concentration of yeast cells and nutrients over time at q=2, u=2, V=2, K=30, r=4, d=15 at the initial starting conditions of x0=[1;3] with t at intervals of 0.1 from 0 to 10.
- Figure 4. The figure above displays the concentration of yeast cells and nutrients over time at q=2, u=2, V=2, K=30, r=4, d=2 at the initial starting conditions of x0=[1;3] with t at intervals of 0.1 from 0 to 10.
- Observations:
- The two figures display what occurs when all variables are kept constant including the initial conditions and time, while the value of d is altered. The comparison of the two plots shows that d affects the rate of change of the concentration of both food and yeast.
- Yet equilibrium was found to exist at the same values of y=0 and c=u
- Question 3: Create a model with two nutrients, both of which are required for the population to grow.
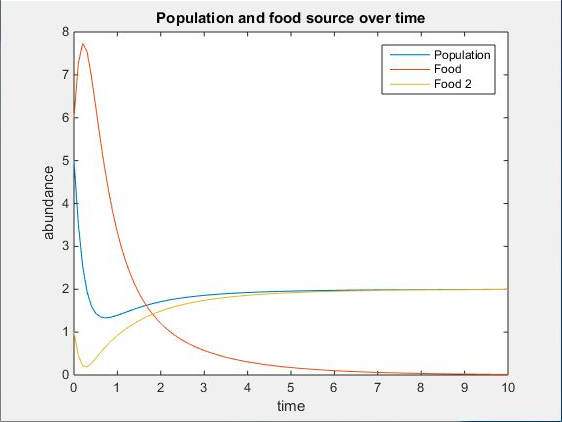
- Figure 5. The figure above displays the two nutrient plot for the values of q=3, u=2, V=10, K=30, r=4 at the initial starting conditions of x0=[5;6;1] with t at intervals of 0.1 from 0 to 10.
- Observations:
- As the concentrations of the two nutrients decrease then level off, the population of yeast decreases then levels off as well.
- In addition there was a decrease in the population of the yeast observed with the introduction of the mortality term as seen by the reduced concentration levels of the yeast compared to the concentration levels in the plots from Question 1 even though the starting conditions were the same.
Data Files
Conclusion
Through the course of this modeling exercise I was able to explore manipulate the parameter variables, initial conditions, and time of a chemostat model in order to observe the effects of the various parts of the model, such as a specific parameter variable, on the concentrations of the yeast and nutrients. The three conditions explored, including a typical chemostat model with one nutrient, one with two nutrients and one with a linear mortality term, allowed me to observe the key features of a chemostat model. For example, it was found that while the yeast and nutrient levels both leveled off, neither plummeted to zero, supporting the key feature of a chemostat, which is that there is a constant fixed flow of nutrients and yeast in and out.
Acknowledgments
- Edited the function and script provided by Dr.Fitzpatrick in order to create the Chemostat dynamics function and script.
- I worked with my classmates Lauren M. Kelly, Conor Keith, Cameron M. Rehmani Seraji, and Margaret J. O'Neil in the Seaver computer lab while creating both my function and script and completing the three questions from the Week 4 Exercise handout.
- Except for what is noted above, this individual journal entry was completed by me and not copied from another source.
- Questions were copied and pasted from the Week 4 Exercise handout.
Nika Vafadari 21:06, 8 February 2017 (EST):
References
Dahlquist, Kam D. (2017) BIOL398-05/S17:Week 4. Retrieved from http://www.openwetware.org/wiki/BIOL398-05/S17:Week_4 on 8 February 2017.
Useful Links
- Nika Vafadari
- Course Home Page
- Weekly Journal Entries
- Shared Journal Pages
- Assignment Pages
- Template:Nika Vafadari
