Jennymchua Week 5 Assignment
From OpenWetWare
Jump to navigationJump to search
Purpose
Methods and Results
Activity 1: Looking at the NCBI Resources and HIV sequence data
Part 1: PubMed
- How did you search for the PubMed entry?
- Next to the search bar, I selected "PubMed" from the drop down menu from which database I would like to search. In the search bar, I typed in "Markham et al. HIV-1 evolution" and scrolled down until I found the article that we were assigned in class.
- What other ways might you have searched?
- I could have used the "Advanced" search option, in which I could have narrowed down the searches by selecting two categories, including "Author," "Date," "Journal," "Title," or "ISBN" as examples. For the Markham piece, I could have selected for "Author" (Markham et al.) and "Journal" (PNAS).
- What other types of related information are available?
- Once on the article page, other information available to browse include:
- "similar articles" (though I am unsure what similar means...similar in terms of topic? In terms of findings?),
- other articles that cited this one,
- related information (where I found the nucleotide sequences),
- images from the publication in a magnified view,
- a glossary of terms used in the paper,
- and my recent activity and interactions with PubMed in terms of searching other articles for other classes.
- Once on the article page, other information available to browse include:
Part 2: GenBank
- What was the accession number of the sequence you chose?
- I chose HIV-1 isolate S3V3-9.
- Which subject of the study was that HIV sequence from?
- This HIV sequence is from Subject 3 on their third visit. This is their ninth clone.
- Which section of the record contains information about who the HIV was collected from?
- The "definition" section of the record contains the information about from whom the HIV was collected.
Part 3: Introduction to Phylogeny.fr
Alignment in Clustal format
CLUSTAL FORMAT: MUSCLE (3.8) multiple sequence alignment
AF089121.1      GATGTAGTAATTAGATCCGCCAATTTCACAGACAATGCTAAAATCATAATAGTACAGCTG
AF089494.1      GAGGTAGTAATTAGATCTGAAAATTTCACGGACAATGCTAAAACCATAATAGTACATCTG
AF016767.2      GGGGTAGTAATTAGATCCGAAAATTTCACAAACAATGCTAAAATCATAATAGTACAGCTG
AF089541.1      GAGGTAGTAATTAGATCCAAGAATTTCACGGATAATGCTAAAATCATAATAGTACAGCTA
                *  **************    ********  * ********** ************ **
AF089121.1      AATGAAACTGTAGTAATGAATTGTACAAGACCCGGCAACAATACAAGAAAAAGGGTAACT
AF089494.1      AATAAATCTGTAGAAATTAATTGCACAAGACCCAACAACAATACAAGAAGAAGTATAAAT
AF016767.2      AATGAATCTGTAAAAATTAATTGTACAAGACCCAACAACAATACAAGAAAAAGTATACAT
AF089541.1      AATGAGACTGTAGAAATTAATTGTACAAGACCCAACAACAATACAAGAAAAAGTATACCT
                *** *  *****  *** ***** *********  ************** ***  **  *
AF089121.1      CTAGGACCAGGCAGAGTATACTATACAACAGGACAAATAATAGGAGATATAAGAAAAGCA
AF089494.1      ATGGGACCAGGGAGAGTATTTTATACAACAGGAGAAATAATAGGAGATATAAGGCAAGCA
AF016767.2      ATAGGACCAGGTAGAGCATTTTATACAACAGGAGACATAATAGGAGATATAAGACCAGCA
AF089541.1      ATAGGACCAGGCAGGGCATTTTATACAACAGGAGAAATAATAGGAGATATAAGACAAGCA
                * ******** ** * **  ************ * *****************   ****
AF089121.1      CATTGTAACCTTAGTAGAGCAGGTTGGAGTAACACTTTAGAAAGGATAGCTATAAAATTA
AF089494.1      CATTGTAACCTTAGTAGAACAAAATGGAATGACACTTTAAAACAGGTAGTTGACAAATTA
AF016767.2      TATTGTAACATTAGTAGAGCAGAATGGGATAACACTTTAAAACAGATAGTTATAAAATTA
AF089541.1      CATTGTAACCTTAGTAGAGCAAAATGGAATGAAACTTTAAAACAGATAGTTATAAAATTA
                ******** ******** **   ***  * * ****** **  * *** *   ******
AF089121.1      AGAGAACAATTTCAGAATAGAACAATAGTCTTTAATCAATCCTCA
AF089494.1      AGAGAACAATTTAGGAATAAAACAATAATCTTTAATCAATCCTCA
AF016767.2      AGAGAACACTTTGGGAATAAAACAATAGTCTTTAATCACTCTTCA
AF089541.1      AAAGAACAATTTAGGAATAAAACAATAGTCTTTAGTCCATCCTCA
                * ****** ***  ***** ******* ****** **  ** ***
Phylogenetic Tree for three randomly selected sequences

Activity 2: Looking at the sources of HIV across subjects
Part 1: Looking at clustering across subjects
| Subject | Clone # |
| 2 | 1 |
| 2 | |
| 3 | |
| 5 | 4 |
| 5 | |
| 6 | |
| 9 | 2 |
| 3 | |
| 4 | |
| 2 | 1 |
| 2 | |
| 3 |
- Do the clones from each subject cluster together?
- It does seem that the clones from each subject cluster together.
- Do some subjects' clones show more diversity than others?
- The clones of Subjects 9 and 15 have more branching than the other subjects, which shows a greater amount of diversity. The more branching off, the more diverse the clones are from the original.
- Do some of the subjects cluster together?
- Subjects 2, 5, and 9 appear to cluster together, while Subject 15's clones are pretty spread apart.
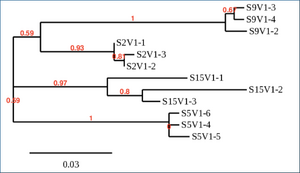
Figure 2. Phylogenetic tree for twelve sequences (three clones from each of four subjects).
- Subjects 2, 5, and 9 appear to cluster together, while Subject 15's clones are pretty spread apart.
- Write a brief description of your tree and how you interpret the clustering pattern with respect to the similarities and potential evolutionary relationships between subjects' HIV sequences.
- This phylogenetic tree shows both clustering and spatial distance, as well as genetic diversity. Subject 15 does not cluster, and the greater the genetic distance infers the longer the time since they shared a common ancester. Subjects 2, 5, and 9, though, are fairly clustered together which means the clones shared a common ancester possibly quite recently. Subjects 9 and 15 branch off more than the other subjects, which also shows that their clones have become more genetically diverse than Subjects 2 or 5.

Part 2: Quantifying diversity within and between subjects
Alignment in Clustal format
CLUSTAL FORMAT: MUSCLE (3.8) multiple sequence alignment
S2V4-3          GAGGTAGTAATTAGATCTGAAAATTTCACGAACAATGCTAAAATCATAATAGTACAGCCG
S2V4-5          GAGGTAGTAATTAGATCTGAAAATTTCACGAACAATGCTAAAATCATAATAGTACAGCTG
S2V4-8          GAGGTAGTAATTAGATCCGAAAATTTCACGAACAATGCTAAAATCATAATAGTACAGCTG
S2V4-7          GAGGTAGTAATTAGATCTGAAAATTTCACGAACAATGCTAAAATCATAATAGTACAGCTG
S2V3-4          GAGGTAGTAATTAGATCCGAAAATTTCATGAGCAATGCTAGAATCATAATAGTACAGCTG
S2V3-3          GAGGTAGTAATTAGATCCGAAAATTTCACGAACAATGCTAAAATCATAATAGTACAGCTG
S2V4-6          GAGGTAGTAATTAGATCCGAAAATTTCACGAACAATGCTAAAATCATAATAGTACAGCTG
S2V1-5          GAGGTAGTAATTAGATCCGAAAATTTCACGAACAATGCTAAAATCATAATAGTACAGCTG
S2V1-4          GAGGTAGTAATTAGATCCGAAAATTTCACGAACAATGCTAAAATCATAATAGTACAGCTG
S2V1-3          GAGGTAGTAATTAGATCCGAAAATTTCACGAACAATGCTGAAATCATAATAGTACAGCTG
S2V1-6          GAGGTAGTAATTAGATCCGAAAATTTCACGAACAATGCTAAAATCATAATAGTACAGCTG
S2V1-2          GAGGTAGTAATTAGATCCGAAAATTTCACGAACAATGCTAAAATCATAATAGTACAGCTG
S2V3-1          GAGGTAGTAATTAGATCCGAAAATTTCACGAACAATGCTAAAATCATAATAGTACAGCTG
S2V4-9          GAGGTAGTAATTAGATCCGAAAATTTCACGAACAATGCTAAAATCATAATAGTACAGCTG
S2V1-1          GAGGTAGTAATTAGATCCGAAAATTTCACGAACAATGCTAAAATCATAATAGTACAGCTG
S2V3-6          GAGGTAGTAATTAGATCCGAAAATTTCACGAACAATGCTAAAATTATAATAGTACAGCTG
S2V3-9          GAGGTAGTAATTAGATCCGAAAATTTCACGAACAATGCTAAAATCATAATAGTACAGCTG
S2V3-2          GAGGTAGTAATTAGATCCGAAAATTTCACGAACAATGCTAAAATCATAATAGTACAGCTG
S2V3-7          GAGGTAGTAATTAGATCCGAAAATTTCACGAACAATGCTAAAATCATAATAGTACAGCTG
S2V3-8          GAGGTAGTAATTAGATCCGAAAATTTCACGAACAATGCTAAAATCATAATAGTACAGCTG
S2V3-5          GAGGTAGTAATTAGATCTGAAAATTTCACGAACAATGCTAAAATCATAATAGTACAGCTG
S2V4-4          GAGGTAGTAATTAGATCCGAAAATTTCACGAACAATGCTAAAATCATAATAGTACAGCTA
S2V4-1          GAGGTAGTAATTAGATCTGAAAATTTCACGAACAATGCTAAAATCATAATAGTACAGCTG
S2V4-2          GAGGTAGTAATTAGATCTGAAAATTTCACGAACAATGCTAAAATCATAATAGTACAGCTG
                ***************** ********** ** *******  *** *************
S2V4-3          AATGAATCTGTAGAAATTAATTGTACAAGACCCAACAACAATACAAGAAAAAGTATACAT
S2V4-5          AATGAATCTGTAGAAATTAATTGTACAAGACCCAACAACAATACAAGAAAAAGTATACAT
S2V4-8          AATGAATCTGTAGAAATTAATTGTACAAGACCCAACAACAATACAAGAAAAAGTATACAT
S2V4-7          AATGAATCTGTAGAAATTAATTGTACAAAACCCAACAACAATACAAGAAAAAGTATACAT
S2V3-4          AATGAATCTGTAGAAATTAATTGTACAAGACCCAACAACAATACAAGAAAAAGTATACAT
S2V3-3          AATAAATCTGTAGAAATTAATTGTACAAGGCCCAACAACAATACAAGAAAAAGTATACAT
S2V4-6          AATGAGTCTGTAGAAATTAATTGTACAAGACCCAACAACAATACAAGAGAAAGTATACAT
S2V1-5          AATGAATCTGTAGAAATTAATTGTACAAGACCCAACAACAATACAAGAAAAAGTATACAT
S2V1-4          AATGAATCTGTAGAAATTAATTGTACAAGACCCAACAACAATACAAGAAAAAGTATACAT
S2V1-3          AATGAATCTGTAGAAATTAATTGTACAAGACCCAACAACAATACAAGAAAAAGTATACAT
S2V1-6          AATGAATCTGTAGAAATTAATTGTACAAGACCCAACAACAATACAAGAAAAAGTATACAT
S2V1-2          AATGAATCTGTAGAAATTAATTGTACAAGACCCAACAACAATACAAGAAAAAGTATACAT
S2V3-1          AATGGATCTGTAGAAATTAATTGTACAAGACCCAACAACAATACAAGAAAAAGTATACAT
S2V4-9          AATGAATCTGTAGAAATTAATTGTACAAGACCCAACAACAATACAAGAAAAAGTATACAT
S2V1-1          AATGAATCTGTAGAAATTAATTGTACAAGACCCAACAACAATACAAGAAAAAGTATACAT
S2V3-6          AATGAATCTGTAGAAATTAATTGTACAAGACCCAACAACAATACAAGAAAAAGTATACAT
S2V3-9          AATGAATCTGTAGAAATTAATTGTACAAGACCCAACAACAATACAAGAAAAAGTATACAT
S2V3-2          AATGAATCTGTAGAAATTAATTGTACAAGACCCAACAACAATACAAGAAAAAGTATACAT
S2V3-7          AATAAATCTGTAGAAATTAATTGTACAAGGCCCAACAACAATACAAGAAAAAGTATACAT
S2V3-8          AATAAATCTGTAGAAATTAATTGTACAAGGCCCAACAACAATACAAGAAAAAGTATACAT
S2V3-5          AATAAATCTGTAGAAATTAATTGTACAAGGCCCAACAACAATACGAGAAAAAGTATACAT
S2V4-4          AATGAATCTGTAGAAATTAATTGCACAAGACCCAACAACAATACAAGAAAAAGTATACAT
S2V4-1          AATGAATCTGTAGAAATTAATTGTACAAGACCCAACAACAATACAAGAAAAAGTATACAT
S2V4-2          AATGAATCTGTAGAAATTAATTGTACAAGACCCAACAACAATACAAGAAAAAGTATACAT
                ***   ***************** ****  ************** *** ***********
S2V4-3          ATAGGACCAGGTAGAGCATTTTATACAACAGGAAACATAATAGGAGATATAAGACAAGCA
S2V4-5          ATAGGACCAGGTAGAGCATTTTATACAACAGGAAACATAATAGGAGATATAAGACAAGCA
S2V4-8          ATAAGACCAGGTAGAGCATTTTATACAACAAGAGACATAATAAGAGAGATAAGACAAGCA
S2V4-7          ATAGGACCAGGTAGAGCATTTTATACAACAGGAAACATAATAGGAGATATAAGACAAGCA
S2V3-4          ATAGGACCAGGTAGAGCATTTTATACAACAGGAGACATAATAGGAGATATAAGACAAGCA
S2V3-3          ATAGGACCAGGTAGAGCATTTTATACAACAGGAGACATAATAGGAGATATAAGACAAGCA
S2V4-6          ATAGGACCAGGTAGAGCATTTTATACAACAGGAGACATAATAGGAGATATAAGACAAGCA
S2V1-5          ATAGGACCAGGTAGAGCATTTTATACAACAGGAGACATAATAGGAGATATAAGACAAGCA
S2V1-4          ATAGGACCAGGTAGAGCATTTTATACAACAGGAGACATAATAGGAGATATAAGACAAGCA
S2V1-3          ATAGGACCAGGTAGAGCATTTTATACAACAGGAGACATAATAGGAGATATAAGACAAGCA
S2V1-6          ATAGGACCAGGTAGAGCATTTTATACAACAGGAGACATAATAAGAGATATAAGACAAGCA
S2V1-2          ATAGGACCAGGTAGAGCATTTTATACAACAGGAGACATAATAGGAGATATAAGACAAGCA
S2V3-1          ATAGGACCAGGTAGAGCATTTTATACAACAGGAGACATAATAGGAGATATAAGACAAGCA
S2V4-9          ATAGGACCAGGTAGAGCATTTTATACAACAGGAGACATAATAGGAGATATAAGACAAGCA
S2V1-1          ATAGGACCAGGTAGAGCATTTTATACAACAGGAGACATAATAGGAGATATAAGACAAGCA
S2V3-6          ATAGGACCAGGTAGAGCATTTTATACAACAGGAGACATAATAGGAGATATAAGACAAGCA
S2V3-9          ATAGGACCAGGTAGAGCATTTTATACAACAGGAGACATAATAGGAGATATAAGACAAGCA
S2V3-2          ATAGGACCAGGTAGAGCATTTTATACAACAGGAGACATAATAGGAGATATAAGACAAGCA
S2V3-7          ATAGGACCAGGTAGAGCATTTTATACAACAGGAGACATAATAGGAGATATAAGACAAGCA
S2V3-8          ATAGGACCAGGTAGAGCATTTTATACAACAGGAGACATAATAGGAGATATAAGACAAGCA
S2V3-5          ATAGGACCAGGTAGAGCATTTTATACAACAGGAGACATAATAGGAGATATAAGACAAGCA
S2V4-4          ATAGGACCAGGTAGAGCATTTTATACAACAGGAGACATAATAGGAGATATAAGACAAGCA
S2V4-1          ATAGGACCAGGTAGAGCATTTTATACAACAGGAGACATAATAGGAGATATAAGACAAGCA
S2V4-2          ATAGGACCAGGTAGAGCATTTTATACAACAGGAGACATAATAGGAGATATAAGACAAGCA
                *** ************************** ** ******** **** ************
S2V4-3          CATTGTAACATTAGTAGAGCAAAATGGAATAACACTTTAAAACAGATAGTTATAAAATTA
S2V4-5          CATTGTAACATTAGTAGAGCAAAATGGAATAACACTTTAAAACAGATAGTTATAAAATTA
S2V4-8          TATTGTAACATTAGTAGAGCAGAATGGAATAACACTTTAAAACAGATAGTTATAAAATTA
S2V4-7          CATTGTAACATTAGTAGAGCAGAATGGAATAACACTTTAAAACAGATAGTTATAAAATTA
S2V3-4          TATTGTAACATTAGTAGAGCAGAATGGAATAACACTTTAAAACAGATAGTTATAAAATTA
S2V3-3          TATTGTAACATTAGTAGAGCAGAATGGAATAACACTTTAAAACAGATAGTTATAAAATTA
S2V4-6          TATTGTAACATTAGTAGAGCAGAATGGAATAACACTTTAAAACAGATAGTTATAAAATTA
S2V1-5          TATTGTAACATTAGTAGAGCAGAATGGAATAACTCTTTAAAACAGATAGTTATAAAATTG
S2V1-4          TATTGTAACATTAGTAGAGCAGAATGGAATAACTCTTTAAAACAGATAGTTATAAAATTG
S2V1-3          TATTGTAACATTAGTAGAGCAGAATGGAATAACACTTTAAAACAGATAGTTATAAAATTG
S2V1-6          TATTGTAACATTAGTAGAGCAGAATGGAATAACACTTTAAAACAGATAGTTATAAAATTG
S2V1-2          TATTGTAACATTAGTAGAGCAGAATGGAATAACACTTTAAAACAGATAGTTATAAAATTG
S2V3-1          TATTGTAACATTAGTAGAGCAGAATGGAATAACACTTTAAAACAGATAGTTATAAAATTA
S2V4-9          TATTGTAACATTAGTAGAGCAGAATGGAATAACACTTTAAAACAGATAGTTATAAAATTA
S2V1-1          TATTGTAACATTAGTAGAGCAGAATGGAATAACACTTTAAAACAGATAGTTATAAAATTG
S2V3-6          TATTGTAACATTAGTAGAGCAGAATGGAATAACACTTTAAAACAGATAGTTATAAAATTA
S2V3-9          TATTGTAACATTAGTAGAGCAGAATGGAATAACACTTTAAAACAGATAGTTATAAAATTA
S2V3-2          TATTGTAACATTAGTAGAGCAGAATGGAATAACACTTTAAAACAGATAGTTATAAAATTA
S2V3-7          CATTGTAACATTAGTAGAGCAGAATGGAATAACACTTCAAAACAGATAGTTAAAAAATTA
S2V3-8          CATTGTAACATTAGTAGAGCAGAGTGGAATAACACTTTAAAACAGATAGTTAAAAAATTA
S2V3-5          CATTGTAACATTAGTAGAGCAGAATGGAATAACACTTTAAAACAGATAGTTAAAAAATTA
S2V4-4          TATTGTAACATTAGTAGAGCAGAATGGAATAACACTTTAAAACAGATAGTTATAAAATTA
S2V4-1          TATTGTAACATTAGTAGAGCAGAATGGAATAACACTTTAAAACAGATAGTTAAAAAATTA
S2V4-2          TATTGTAACATTAGTAGAGCAGAATGGAATAACACTTTAAAACAGATAGTTAAAAAATTA
                ******************** * ********* *** ************** ******
S2V4-3          AGAAAACAATTTGAGAATAAAACAATAGTCTTTAGCCACTCCTCA
S2V4-5          AGAAAACAATTTGAGAATAAAACAATAGTCTTTAGTCACTCCTCA
S2V4-8          AGAGAACACTTTAAGAATAAAACAATAGTCTTTAATCACTCCTCA
S2V4-7          AGAGAACACTTTGGGAATAAAACAATAGTCTTTAATCACTCCTCA
S2V3-4          AGAGAACACTTTGGGAATAAAACAATAGTCTTTAATCACTCCTCA
S2V3-3          AGAAAACACTTTGGGAATAAAACAATAGTCTTTAATCACTCCTCA
S2V4-6          AGAGAACACTTTGGGAATAAAACAATAGTCTTTAATCACTCCTCA
S2V1-5          AGAGAACACTTTGGAAATAAAACAATAGTCTTTAGTCACTCCTCA
S2V1-4          AGAGAACACTTTGGGAATAAAACAATAGTCTTTAGTCACTCCTCA
S2V1-3          AGAGAACACTTTGGGAATAAAACAATAGTCTTTAGTCACTCCTCA
S2V1-6          AGAGAACACTTTGGGAATAAAACAATAGTCTTTAGTCACTCCTCA
S2V1-2          AGAGAACACTTTGGGAATAAAACAATAGTCTTTAGTCACTCCTCA
S2V3-1          AGAAAACACTTTGGGAATAAAACAATAGTCTTTAATCACTCCTCA
S2V4-9          AGAAAACACTTTGGGAATAAAACAATAGTCTTTAATCACTCCTCA
S2V1-1          AGAGAACACTTTGGGAATAAAACAATAGTCTTTAATCACTCCTCA
S2V3-6          AGAGAACACTTTGGGAATAAAACAATAGTCTTTAATCACTCCTCA
S2V3-9          AGAGAACACTTTGGGAATAAAACAATCGTCTTTAATCACTCCTCA
S2V3-2          AGAGAACACTTTGGGAATAAAACAATAGTCTTTAATCACTCCTCA
S2V3-7          AGAGAACACTTTAAGAATAAAACAATAGTCTTTAATCACTCCTCA
S2V3-8          AGAGAACACTTTAAGAATAAAACAATAGTCTTTAATCACTCCTCA
S2V3-5          AGAGAACACTTTAAGAATAAAACAATAGTCTTTAATCACTCCTCA
S2V4-4          AGAGAACACTTTAAGAATAAAACAATAGTCTTTAATCACTCCTCA
S2V4-1          AGAGAACACTTTAAGAATAAAACAATAGTCTTTAATCACTCCTCA
S2V4-2          AGAGAACACTTTAAGAATAAAACAATAGTCTTTAATCACTCCTCA
                *** **** ***   *********** *******  *********
Table 2. Quantifying diversity within and between Subjects 2, 4, and 5
| Subject | Number of Clones | S | Theta |
|---|---|---|---|
| 2 | 24 | 36 | 8.63 |
| 4 | 47 | 62 | 14.0 |
| 5 | 43 | 58 | 13.3 |
Activity 3: Defining your HIV evolution research project
- What is your question?
- We are interested in determining if there is a relationship between CD4 levels and average pairwise genetic distance (theta) and furthermore, if there is statistical significance between these two values within each progressor group and between groups.
- Make a hypothesis before analysis.
- We predict that there is a relationship between genetic diversity and CD4 levels and between groups, though there may not be significance within groups.
- Which subjects, visits, and clones will you use?
- Subjects
- We will use subjects 2, 12, 13, 6, 5, 8, 1, 15, 10, 9, 11, and 4.
- Visits
- We will use all visits for each subject.
- Clones
- We will use all clones for each subject.
- Subjects
We chose these subjects, visits, and clones on the basis of ensuring each progression group was represented and enough visits and clones were included.
Data and Files
- Clones of genetic data from visits for Subjects 1-9
- Clones of genetic data from visits for Subjects 10-15
Conclusion
In order to prepare for analyzing the genetic data from Markham et. al., it was crucial to understand how to manipulate phylogenetic trees, clustering sequences, and calcuate statistical averages in this week's lab. For the future, these skills will be important in understanding how the original authors analyzed and discussed their findings.
Acknowledgements
- I copied the table syntax from the Week 5 Class Assignment page.
- I worked with my homework partner Nick Yeo in class and via text throughout the week to further discuss our HIV evolution project.
- I used this website to calculate a harmonic sum for Activity 2: Part 2.
- Except for what is noted above, this individual journal entry was completed by me and not copied from another source.
Jennymchua (talk) 20:38, 19 February 2020 (PST)
References
- Markham, R.B., Wang, W.C., Weisstein, A.E., Wang, Z., Munoz, A., Templeton, A., Margolick, J., Vlahov, D., Quinn, T., Farzadegan, H., & Yu, X.F. (1998). Patterns of HIV-1 evolution in individuals with differing rates of CD4 T cell decline. Proc Natl Acad Sci U S A. 95, 12568-12573. doi: 10.1073/pnas.95.21.12568 (PubMed ID: 9770526)
- OpenWetWare. (2020). BIOL368/S20:Week 5. Retrieved February 19, 2020, from https://openwetware.org/wiki/BIOL368/S20:Week_5.
- NCBI (2020). PubMed. Retrieved February 19, 2020, from https://www.ncbi.nlm.nih.gov/pubmed/9770526.
- Phylogeny.fr. (2020) Phylogeny.fr:Home. Retrieved February 19, 2020, from http://www.phylogeny.fr/.
My user page
Template link
Class Assignments
- BIOL368/S20:Week 1
- BIOL368/S20:Week 2
- BIOL368/S20:Week 3
- BIOL368/S20:Week 4
- BIOL368/S20:Week 5
- BIOL368/S20:Week 6
- BIOL368/S20:Week 8
- BIOL368/S20:Week 9
- BIOL368/S20:Week 10
- BIOL368/S20:Week 11
- BIOL368/S20:Week 13
- BIOL368/S20:Week 14
Weekly Assignments
- jennymchua Week 2 Assignment
- jennymchua Week 3 Assignment
- jennymchua Week 4 Assignment
- jennymchua Week 5 Assignment
- jennymchua Week 6 Assignment
- jennymchua Week 7 Assignment
- jennymchua Week 8 Assignment
- jennymchua Week 10 Assignment
- jennymchua Week 11 Assignment
- jennymchua Week 13 Assignment
- jennymchua Week 14 Assignment
Class Journals
- BIOL368/S20:Class Journal Week 1
- BIOL368/S20:Class Journal Week 2
- BIOL368/S20:Class Journal Week 3
- BIOL368/S20:Class Journal Week 4
- BIOL368/S20:Class Journal Week 5
- BIOL368/S20:Class Journal Week 6
- BIOL368/S20:Class Journal Week 8
- BIOL368/S20:Class Journal Week 9
- BIOL368/S20:Class Journal Week 10
- BIOL368/S20:Class Journal Week 11
- BIOL368/S20:Class Journal Week 13
- BIOL368/S20:Class Journal Week 14
