Conor Keith Week 9
From OpenWetWare
Jump to navigationJump to search
Conor Keith 01:45, 16 March 2017 (EDT)
Purpose
- The purpose of this assignment is to introduce DNA microarrays and learn how they can be used to analyze the behavior of genes.
Discovery Questions


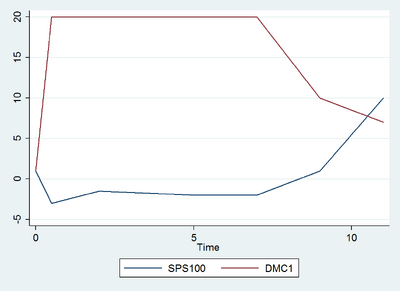
- X and Y were transcribed relatively similarly. Both started at Black, then transcribed to Red, and ended at Green. Z remained relatively constant at Red.
- It is reasonable that most spots are initially yellow, as this indicates no change. At the initial point genes are not induced or repressed. Yellow is a mix of the other two possible colors, Red and Green.
- Over the course of the experiment TEF4 was repressed. TEF4 stimulates the binding of AA-tRNA to ribosomes. Lower rates of translation could be a response to a reduction in glucose
- TCA cycle genes are induced to support stress response under glucose starvation. The TCA cycle can produce ATP, NADH and FADH2 without the use of glucose. So TCA cycle genes are expressed to continue to produce energy in the absence of glucose.
- To ensure genes for enzymes are induced or repressed simultaneously the genome could cluster genes in the same promoter sequence. Gene clusters utilize microarray data to find groups of genes that share common attributes.
- The spots that represent glucose-repressed genes would appear red later in the experiment, as glucose starvation will lead to higher expression levels of these genes.
- Yap1p target spots would be red. Yap1p is resistant to glucose starvation, so they would continue to be expressed.
- If TUP1 is actually deleted the target spots would remain black throughout the whole experiment. IF Yap1p was overexpressed, the target spots would remain red throughout the experiment.
Presentation Model Redo
Acknowledgements
- This individual journal entry was completed by me and not copied from any other source.
References
- Alberts et al. (2002) Molecular Biology of the Cell, Ch. 8: Microarrays
- Microarray animation
- Brown, P.O. & Botstein, D. (1999) Exploring the new world of the genome with DNA microarrays Nature Genetics 21: 33-37.
- Campbell, A.M. and Heyer, L.J. (2003), “Chapter 4: Basic Research with DNA Microarrays”, in Discovering Genomics, Proteomics, and Bioinformatics, Cold Spring Harbor Laboratory Press, pp. 107-124.
- DeRisi, J.L., Iyer, V.R., and Brown, P.O. (1997) Exploring the Metabolic and Genetic Control of Gene Expression on a Genomic Scale. Science 278: 680-686.
Assignment Pages:
- Week 1 Assignment
- Week 2 Assignment
- Week 3 Assignment
- Week 4 Assignment
- Week 5 Assignment
- Week 6 Assignment
- Week 7 Assignment
- Week 9 Assignment
- Week 10 Assignment
- Week 11 Assignment
- Week 12 Assignment
- Week 14/15 Assignment
Individual Journal Entries :
- Conor Keith Week 2
- Conor Keith Week 3
- Conor Keith Week 4
- Conor Keith Week 5
- Conor Keith Week 6
- Conor Keith Week 7
- Conor Keith Week 9
- Conor Keith Week 10
- Conor Keith Week 11
- Conor Keith Week 12
- Conor Keith Week 14/15
Shared Journal Pages: