Conor Keith Week 10
From OpenWetWare
Jump to navigationJump to search
Purpose
- The purpose of this assignment is to read, outline, and present on an article whose authors found a new method for modeling gene networks.
Definitions
- Transcriptome: a collection of all gene readouts present in a cell. https://www.genome.gov/13014330/
- Putative: Denoting a supposition or inference based on what was commonly believed, reputed, or deemed rather than on a direct evidence http://www.biology-online.org/dictionary/Putative
- Fuzzy Logic: a system of logic in which a statement can be true, false, or any of a continuum of values in between https://www.merriam-webster.com/dictionary/fuzzy%20logic
- Motif: The smallest group of atoms in a polymer that, when under the influence of a rotation-translation operator, will assemble the rest of the atoms in the chain. http://www.biology-online.org/dictionary/Motif
- Gene Expression Profile: A laboratory test that identifies all of the genes in a cell or tissue that are making messenger RNA. Messenger RNA molecules carry the genetic information needed to make proteins. A gene expression profile may be used to find and diagnose a disease or condition or to see how well the body responds to treatment. https://www.cancer.gov/publications/dictionaries/cancer-terms?cdrid=386201
- Activator: a DNA-binding transcription metabolite that positively modulates an allosteric Enzyme or regulates one or more genes by increasing the rate of transcription. http://www.biology-online.org/dictionary/Activator
- Repressor: a regulatory protein that binds to an operator and blocks transcription of the genes of an operon. http://www.biology-online.org/dictionary/Repressor
- Enzyme Kinetics: the study of the rates, and alterations in those rates, of enzyme-catalyzed reactions; includes the reactions catalyzed by synzymes, abzymes, and ribozymes.http://medical-dictionary.thefreedictionary.com/enzyme+kinetics
- Gene Regulatory Network: Interacting DNA-encoded regulatory subsystems in the Genome that coordinate input from activator and repressor Transcription Factors during development, cell differentiation, or in response to environmental cues. The networks function to ultimately specify expression of particular sets of Genes for specific conditions, times, or locations. http://www.reference.md/files/D053/mD053263.html
- Phosphorylation: The transferring of phosphoryl group from a donor to the recipient molecule http://www.biology-online.org/dictionary/Phosphorylation
Outline
Main Result
- The authors presented a new, more general model of the kinetic profile of genetic networks. This new model makes possible to generate the target gene expression profile from the gene expression profile of the regulator. The model offers a comprehensive analysis of the influence of regulators on target genes.
Significance of Work
- Unlike many previous models, the model introduced in the article breaks gene networks down into its most elementary parts for accurate analysis. Models of large genetic networks as a whole have a large chance of encountering model error. This model is able correctly identify activator and repressor interactions with higher accuracy than models from previous research.
Methods
Previous Research
- Grouped genes based on different types of binding of transcriptional regulators.
- Used differential equations to identify patterns to construct a more general linear model.
Method From Article
- Uses nonlinear model
- Procedure:
- Select pool of 184 potential regulators using data from previous research.
- Select 40 target genes for S. cerevisiae
- Select genes from pool to test the model and see if it fits gene expression profile.
- Repeat for 40 target genes.
- Identify actual regulators using model.
Results
Dynamic Model of Transcriptional Control
- The model is derived by assuming the recursive action of regulators on the target over time. The model assumes that the regulatory effect on the expression of a particular gene can be expressed as a combinatorial action of its regulators.
Equation 1
- represents target gene expression level z at time t + dt
- [math]\displaystyle{ g\approx. \sum w_j y_j - b }[/math]
- g= regulatory effect for specific gene
- yj= expression levels of regulators at time t
- wj= regulatory weights of genes controlling target gene
- j= 1, 2,…,m ( m= number of regulators controlling gene)
- b= parameter that represents delay of transcription initiation/ unspecified bias from regulatory effects of gene expression
Equation 2
- rate of expression of a target gene (dz/dt)
- [math]\displaystyle{ \rho = \frac{1}{(1+exp(-\sum w_j y_j - b))} }[/math]
- p= regulatory effect g of regulators j transformed by sigmoidal transfer function (regulatory effects of other genes)
- x= effect of degradation (x=k.z.)
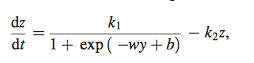
Equation 3
- models control of target gene expression z
- [math]\displaystyle{ \frac{dz}{dt} = k_1\frac{1}{(1+exp(-\sum w_j y_j - b))}-k_2 z }[/math]
- k2= rate constant of degradation of product of target gene
- k1= maximal rate of expression
Equation 4
- simplified version of equation 3 that only considers one transcriptional factor
- y= approximated with a polynomial of degree n (shown below in equation 5)

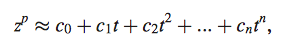
Equation 5
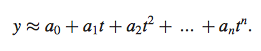
- used least squares minimization procedure to calculate coefficients {a0, . . , an} from experimental gene expression profile
- assumed same weight of error for all measured points
- degree n= must be chosen individually for each experiment based on number of data points in profile and fluctuation due to experimentation to reflect rate of changes in gene expression within the specific experiment (for yeast cell cycle chose n=6)

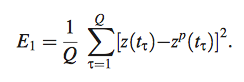
Equation 6
- to identify the gene profiles that minimize the mean/average square error function
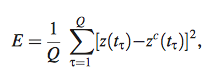
- Z= z(t) = expression profiles of target gene at time points t for Q data points (1,2,…,Q)
- Y= y(t)= expression profiles of regulator gene at time points t for Q data points
- Q= number of data points (data points calculated by equation 4 model)
- z^c(t)= reconstructed profiles of Z at time points t for Q data points

Equation 7
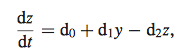
- In order to minimize error function (equation 6), data was entered into both nonlinear model and linear model to compare the calculated parameters (w, b, k1, k2) represented by d.

Computational Algorithm
- Fit regulator gene profiles with a polynomial of degree n (Equation 5).
- Select a target gene.
- Select a candidate regulatory gene from the pool of possible regulators.
- Apply least squares minimization procedure to the target and regulator genes using Equation 4 with error function 6.
- Go to step 3 and repeat for all possible regulators
- Select regulators that best satisfy the selection criterion.
- Go to step 2 and repeat for all target genes.
Dataset Selection
- Used dataset published by Spellman et al.
- Records changes in gene expression measured as amounts of mRNA using microarrays at 18 time points over two cell cycles.
- Chip contains 6178 open reading frames.
Inference of Regulators
- Data in form of log base 2 ratio between actual value of mRNA divided by the value of a standard.
- Whole time series scaled by value of the standard.
- Least squares minimization applied to each target gene for all potential regulators.
Equation 8
- estimates unknown real gene expression profile of target gene
- approximation takes into account error due experiment/ natural fluctuations by polynomial fit rather than statistical model, which could have been used

Equation 9
- calculates the deviation from experimental data
- Identify probable regulator for given target by finding regulator profile which models best target profile and minimizes E.

Results From Table 1
- Summary of identification of regulators for 40 selected yeast cell cycle regulated genes.
- Summarizes correct identification of regulators for all target genes.
- Of the regulators selected as 'best' were identified correctly as regulators for only 35% of target genes.
- But, average false positive rate, ratio between regulators identified as false positives and the total number of potential regulators is low (1.1%).
- Increase in false positive rate caused by only a few targets, whose profiles could be modeled by almost any regulator.
Results From Figure 1
- Expression profiles of 12 cell cycle regulated genes and their predicted regulators.
- Horizontal axis: time points
- Vertical axis: expression relative to time point zero
- Time courses of expression of target genes estimated by the procedure fit well with the observed ones.
Slides for Presentation
Acknowledgements
- For this weeks assignment I worked with my homework partner Nika Vafadari. We met in the classroom and communicated over text. Other than what was noted above this assignment was completed by me without assistance from an outside source.
References
- Dahlquist, Kam D. (2017) BIOL398-05/S17:Week 10. Retrieved from http://www.openwetware.org/wiki/BIOL398-05/S17:Week_10 on 27 March 2017.
- Vu, T. T., & Vohradsky, J. (2007). Nonlinear differential equation model for quantification of transcriptional regulation applied to microarray data of Saccharomyces cerevisiae. Nucleic acids research, 35(1), 279-287. doi: 10.1093/nar/gkl1001
Conor Keith 02:56, 30 March 2017 (EDT)
Assignment Pages:
- Week 1 Assignment
- Week 2 Assignment
- Week 3 Assignment
- Week 4 Assignment
- Week 5 Assignment
- Week 6 Assignment
- Week 7 Assignment
- Week 9 Assignment
- Week 10 Assignment
- Week 11 Assignment
- Week 12 Assignment
- Week 14/15 Assignment
Individual Journal Entries :
- Conor Keith Week 2
- Conor Keith Week 3
- Conor Keith Week 4
- Conor Keith Week 5
- Conor Keith Week 6
- Conor Keith Week 7
- Conor Keith Week 9
- Conor Keith Week 10
- Conor Keith Week 11
- Conor Keith Week 12
- Conor Keith Week 14/15
Shared Journal Pages:
