Conor Keith Week 4
From OpenWetWare
Jump to navigationJump to search
Purpose
- The purpose of this assignment is to model the growth of yeast populations and nutrient concentrations in a Chemostat, and to analyze the effects of changes in rates and other parameters on yeast growth rates.
Workflow
Problem 1
- I first analyzed the nutrient/population model used in the assignment. The state variables were: 'c' the concentration of the nutrient and 'y' the population of yeast. The parameters were: the dilution rate 'q', the volume of the mixture 'V', the net growth rate 'r', the feed concentration 'u', and a constant 'K'.
- I calculated an equilibrium point for the two equations my simultaneously solving the two equations by hand.
- I then opened a new script in Matlab to define a function containing the concentration and yeast growth differential equations. The state variable 'c' was denoted as 'x(1)' and the state variable 'y' was denoted 'x(2)'. I created global macros for each of the parameters (q,u,V,r,K).
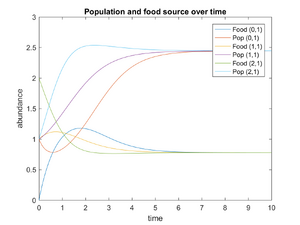
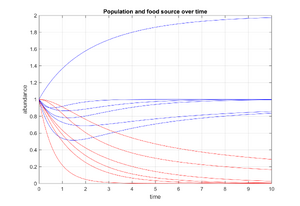
- I then opened a new script to plot the differential equations. I created plots of the growth of yeast/nutrients first varying initial conditions 'xO'. I used a time interval of 10 in increments of 0.01 for all of my plots.
- After plotting the growth with varying initial conditions, I created a new growth plot with varying parameters/rates.
Problem 2
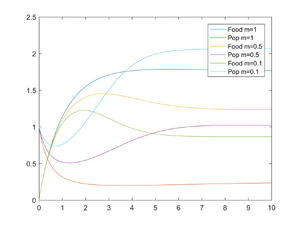
- For part 2, I opened a new script to define a new function, this time with a linear death rate on the population equation. To accomplish this, I added a new parameter 'm' for mortality. I then subtracted 'm*x(2)' from the population equation from part 1.
- I then repeated the same steps used for plotting yeast/nutrients from part 1, varying both initial conditions and parameters.
Problem 3
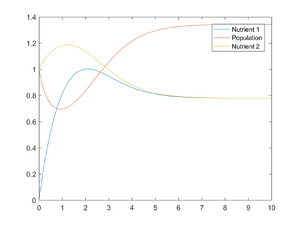
- For part 3, I opened another new script to define a new function, this time containing three differential equations. One equation for yeast growth 'x(2)', one for the first nutrient 'x(1)' and one for the second nutrient 'x(3)'.
- The two nutrient equations were identical, but the conversion factor was edited to account for the addition of a third nutrient.
- I then plotted the 3 equations with initial conditions 'x0=[0;1;1], using the same method from parts 1-2.
Results
- (a) The state variables are: 'c' the concentration of the nutrient and 'y' the population of yeast. The parameters are: the dilution rate 'q', the volume of the mixture 'V', the net growth rate 'r', the feed concentration 'u', and a constant 'K'. (b) One equilibrium is (c,y) = (u,0). (c) At initial condition (c,y) = (0,1) the concentration of nutrients starts at zero and yeast population start at 1. The yeast starts growing very quickly, and feed concentration decreases. Near time = 2, the yeast stops growing and feed concentration grows exponentially. The inflow rate of nutrients in figure 1 is constant at 2.0. 'q', the dilution rate is constant at 1. For each of the individual initial conditions, yeast growth stops when outflow rate 'q*c' surpasses inflow rate and nutrients are used up. Figure 2 shows how yeast growth and nutrient concentration changes with changing parameters/rates. Increases in dilution rates causes population of yeast to grow more slowly, as the concentration of nutrients decreases. Increases in r cause yeast population to grow faster.
- The addition of a linear mortality term slows the growth of yeast population over time. The growth curve will increase slower, and decrease faster. (c,y)=[u,0] is still a steady state equilibrium. Figure 3 shows a plot of yeast growth and nutrients with the addition of a mortality term.
- Figure 4 shows a plot of yeast growth and nutrient concentration for two separate nutrients.
Data and Files
Conclusion
- In a chemostat, yeast growth is determined not only by nutrient concentration, but also by factors like dilution rates, mortality rates, and the volume of the chemostat. Minor changes in any of these parameters can create a major shift in the growth rate of yeast and the path of the growth.
Acknowledgements
- For this weeks assignment, our entire class was in Seaver 120 working on the project at the same time. We discussed some aspects of the assignment as a group. I received data and instructions from the Week 4 assignment page. Except for what is noted above, this individual assignment was completed by me and not copied from any other source.
References
Conor Keith 00:59, 9 February 2017 (EST)
Assignment Pages:
- Week 1 Assignment
- Week 2 Assignment
- Week 3 Assignment
- Week 4 Assignment
- Week 5 Assignment
- Week 6 Assignment
- Week 7 Assignment
- Week 9 Assignment
- Week 10 Assignment
- Week 11 Assignment
- Week 12 Assignment
- Week 14/15 Assignment
Individual Journal Entries :
- Conor Keith Week 2
- Conor Keith Week 3
- Conor Keith Week 4
- Conor Keith Week 5
- Conor Keith Week 6
- Conor Keith Week 7
- Conor Keith Week 9
- Conor Keith Week 10
- Conor Keith Week 11
- Conor Keith Week 12
- Conor Keith Week 14/15
Shared Journal Pages:
