Carolyne week 6
Purpose
The purpose of this project is to determine how the location and identity of nucleotide differences observed in HIV clones in subjects with a similar slope of divergence affects viral virulence. The data from these subjects are taken from the data generated in the Markham et. al. (1998) study.
Question and Hypothesis
- Question: How does the location and identity of nucleotide differences observed in HIV clones in subjects with a similar slope of divergence relate to virulence?
- Hypothesis:
- Clones from subjects within the same progressor group will more closely related.
- Progressor groups will show biases to certain nucleotides at some locations, such that similar progressor groups will have similar changes in nucleotides at similar locations.
Methods
Part 1: Sequence Alignment and Phylogenetic Tree Creation
- I went to Nucleotide Sequence Data and copied all of the sequences for all the clones present at visit 1 in subjects 2, 3, 5, 11, 13, and 14.
- I went to Phylogeny.fr and copied all of the sequences into the white box. All of the sequences were aligned using Multiple sequence alignment. The phylogenetic tree generated was downloaded as a PDF.
- I then repeated this process for all of the clone sequences recovered during visit 4 from the aforementioned subjects.
- Afterwards, multiple sequence alignment and phylogenetic tree building were done for all the clones from visits 1 and 4 that were recovered from subjects 2, 3, 5, 11, 13, and 14.
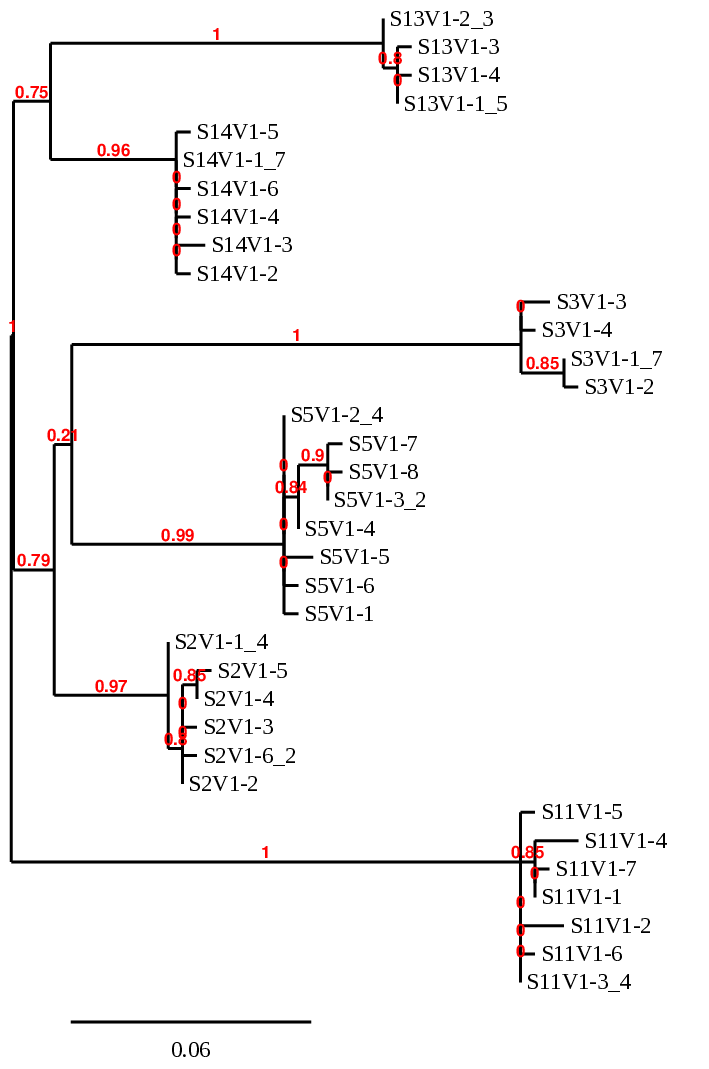
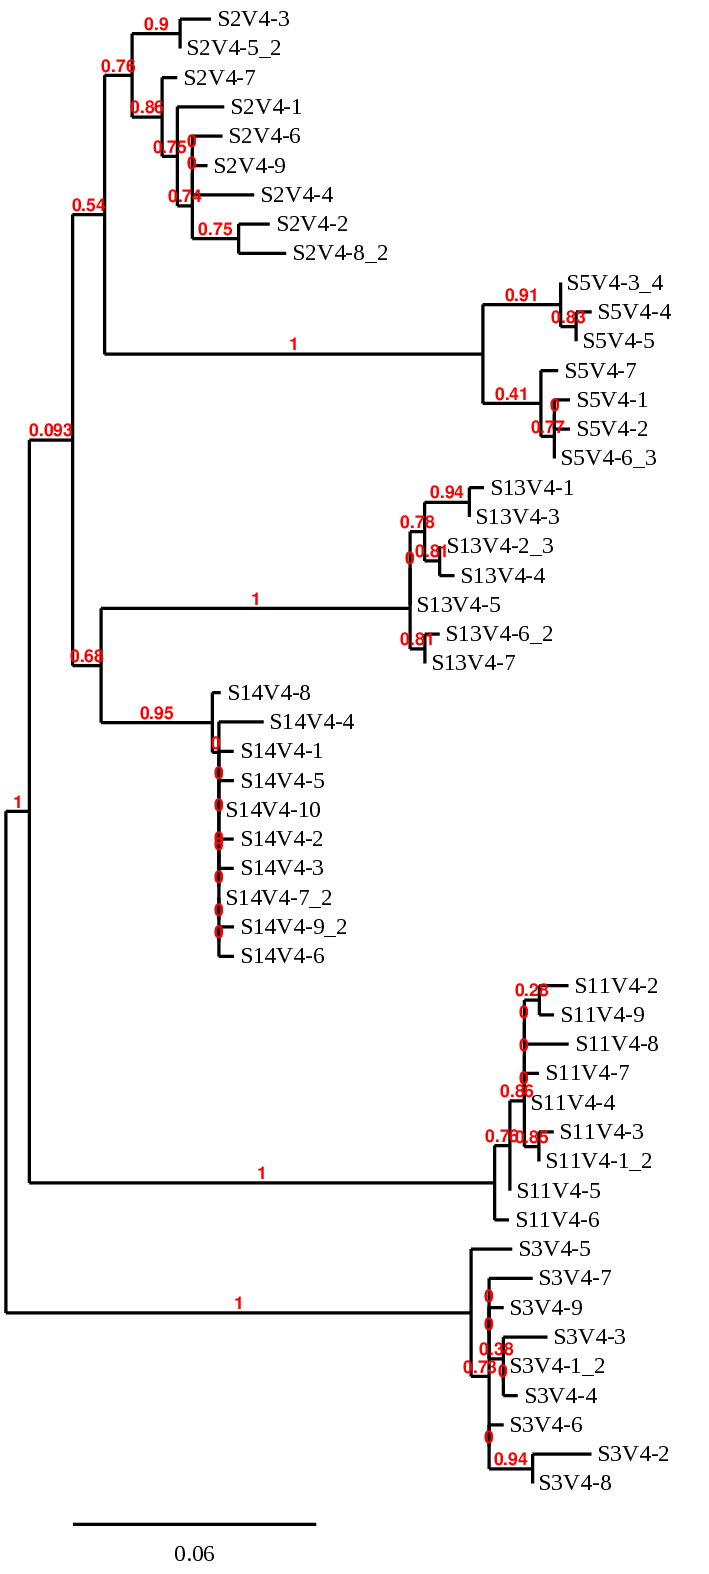
- The first two phylogenetic trees were analyzed to determine which subjects had clones that were more closely related at visits 1 and at visit 4.
- The last phylogenetic tree was analyzed to determine how the clones from each subject were evolutionarily related to the other clones form other subjects.
Part 2: Sequence Analysis
- Sequences were analyzed using Microsoft Word and Microsoft Excel
- The aligned sequences for visit 1 and visit 4 were copied into Microsoft Word. The sequences in Word were copied to a new Excel document.
- To create columns out of the text, we selected all of the columns that had the text containing the clone name and corresponding sequence
- Then we went to Data -> Text to Column...
- A pop-up box appeared, and we selected "Fixed width"
- Then we created column breaks between each letter in the sequence and between the first letter and clone mane for the sequence.
- Then we selected "general" for the column data format and clicked finish to create the columns.
- I changed the font color of each nucleotide in the sequences
- Nathan had analyzed which sequences were the hotspot regions, so I copied the hotspot #1 sequence into word for visit 1 and visit 4 into a new document for Microsoft Word. I then organized the sequences into FASTA format.
- I went to the Weblogo website, entered the sequences, and saved the resulting image as a png file. I created separate graphs for rapid, moderate, and nonprogressor groups. In addition, I also created an overall graph for all groups as well.
Results
Phylogenetic Tree Results
- Analysis of the phylogenetic trees showed that clones were most closely related to other clones from the same subject. When looking at how clones from different progressor groups were related, it appeared that clones from the same progressor group were not closely related. Instead, clones seemed to share greater similarities with clones from different progressor groups. For example, in the visit 1 phylogenetic tree, it appears that clones from subject 14 (moderate progressor) and subject 13 (nonprogressor) were more closely related to each other than to clones from their respective progressor groups. Along the same lines, clones from subject 5 (moderate progressor) appear more closely related to clones from subject 3 (nonprogressor) at visit 1. But at visit 4, the clones from subject 5 are more closely related to clones from subject 2 (rapid progressor).
- Phylogenetic tree of visit 1 and visit 4 sequences
- Phylogenetic tree of visit 1 sequences
- Phylogenetic tree of visit 4 sequences
Sequence Alignment Results Graph for Hotspot #1
- Using the website WebLogo, I was able to create a visual bar graph that shows which nucleotides are most common at each position in the hotspot regions. I created a graph for the first hotspot, which includes positions 17-32 in the nucleotide sequence of the V3 region. The sequences used were all the sequences from visit 1 and visit 4 for Subjects 2, 3, 5, 11, 13, and 14. The bar graph from hotspot #1 shows that there are some positions that are in consensus among all progressor groups, but there are others that appear to have much more diversity in nucleotide identity.
- Bar graph for all sequences from visits 1-4
- Rapid progressor sequences graph from visits 1-4
- Moderate progressor sequences graph from visits 1-4
- Nonprogressor sequences graph from visits 1-4
Discussion and Conclusion
The evolutionary trees, taken in isolation, seem to suggest that clones from subjects in the same progressor group are not closely related. However, several clones were more closely related to clones taken from subjects in a different progressor group. In these cases, moderate clones were related to clones from a subject that was in a nonprogressor or rapid group. It is unclear how or why the close evolutionary relationships between clones of different progressor groups exist. In addition, it is also unclear what changes are occurring to prevent or lead to changes in evolutionary relationships over time. However, the results seem to suggest that evolutionary lineage is not the best predictor of HIV virulence (defined as viral progression speed in this project).
When looking at the consensus sequences, some insight is gained into sequence differences between each progression group. Each group appears to have nucleotide differences in relatively the same location. For example, when looking at the overall hotspot sequence consensus graph, positions 18-20 show great variation which suggests each progressor group has a slightly different sequence in that location. There are some locations where depending on the progressor group, a certain nucleotide is more likely to be found at that location. For example, at position 20, rapid progressors are more likely to have an A or G present whereas non-progressors are more likely to have an A or C present.
Overall, the results obtained from the study partially support our hypothesis that similar nucleotide changes at locations in the V3 sequence will be observed between progressor groups. Without looking at the amino acid sequences, it is difficult to know if these small differences in the sequence identities lead to important structural changes that may relate to virulence. Thus, a follow-up study would be to analyze the amino acid sequences produced by these nucleotide sequences to determine if there are structural changes that are not easily revealed in the DNA sequences. In addition, it would be useful to do these sequence analysis on other sequences in HIV that are highly variable to determine if sequence difference can be identified among viruses with different virulence.
Data and Files
- Alignments for visit 1
- Hotspots for visit 1
- Visit 1 sequences alignment analysis (in Excel)
- Media:Egekeze On Nucleotide changes in V3 region (1).pptx.zip
Acknowledgements
I worked with my partner, Nathan, to analyze the sequences that we used in this project. He figured out how to align the sequences in excel and did most of the sequence alignment analysis for the project. We talked in class last Thursday and met in the library on Wednesday to work on the presentation and talk about how to analyze the sequences. We received help from Dr. Dahlquist over email to figure out how to analyze the sequence data that we had. I copied the syntax for the data and files links from MediaWiki. I used the website Phylogeny.fr to create the phylogenetic trees and used the website Weblogo to create the letter-bar graph for the "hotspot" sequences. I followed the protocol and copied the Markham et. al. (1998) reference from the Week 6 assignment page as well. Except for what is noted above, this individual journal entry was completed by me and not copied from another source. Carolyne (talk) 21:19, 26 February 2020 (PST)
References
- Crooks, G.E., Hon, G., Chandonia, J.M., Brenner, S.E. (n.d.). Create. Weblogo. https://weblogo.berkeley.edu/logo.cgi
- Markham, R.B., Wang, W.C., Weisstein, A.E., Wang, Z., Munoz, A., Templeton, A., Margolick, J., Vlahov, D., Quinn, T., Farzadegan, H., & Yu, X.F. (1998). Patterns of HIV-1 evolution in individuals with differing rates of CD4 T cell decline. Proc Natl Acad Sci U S A. 95, 12568-12573. doi: 10.1073/pnas.95.21.12568
- OpenWetWare. (2020). BIOL368/S20:Week 6. Retrieved February 20, 2020, from https://openwetware.org/wiki/BIOL368/S20:Week_6.
- MediaWiki. (2020). Help:Linking to files. Retrieved February 26, 2020, from https://www.mediawiki.org/wiki/Help:Linking_to_files
- Dereeper A.*, Guignon V.*, Blanc G., Audic S., Buffet S., Chevenet F., Dufayard J.F., Guindon S., Lefort V., Lescot M., Claverie J.M., Gascuel O. Phylogeny.fr: robust phylogenetic analysis for the non-specialist. Nucleic Acids Res. 2008 Jul 1;36(Web Server issue):W465-9. Epub 2008 Apr 19.
- Phylogeny.fr. (n.d.). Retrieved February 20, 2020, from http://www.phylogeny.fr/simple_phylogeny.cgi
User Page and Template Links
- User page: Carolyn C. Egekeze
- Template: Template:Carolyne
Individual Journal Pages
- Carolyne week 2
- Carolyne week 3
- Carolyne week 4
- Carolyne week 5
- Carolyne week 6
- Carolyne week 8
- Carolyne week 9
- Carolyne week 10
- Carolyne week 11
- Carolyne week 13
- Carolyne week 14
Weekly Assignments
- BIOL368/S20:Week 1
- BIOL368/S20:Week 2
- BIOL368/S20:Week 3
- BIOL368/S20:Week 4
- BIOL368/S20:Week 5
- BIOL368/S20:Week 6
- BIOL368/S20:Week 8
- BIOL368/S20:Week 9
- BIOL368/S20:Week 10
- BIOL368/S20:Week 11
- BIOL368/S20:Week 13
- BIOL368/S20:Week 14
Class Journal Pages
- BIOL368/S20:Class Journal Week 1
- BIOL368/S20:Class Journal Week 2
- BIOL368/S20:Class Journal Week 3
- BIOL368/S20:Class Journal Week 4
- BIOL368/S20:Class Journal Week 5
- BIOL368/S20:Class Journal Week 6
- BIOL368/S20:Class Journal Week 8
- BIOL368/S20:Class Journal Week 9
- BIOL368/S20:Class Journal Week 10
- BIOL368/S20:Class Journal Week 11
- BIOL368/S20:Class Journal Week 13
- BIOL368/S20:Class Journal Week 14


