Anna Horvath Week 2
Template
User Pages
Assignments
- Week 1 Assignment
- Week 2 Assignment
- Week 3 Assignment
- Week 4 Assignment
- Week 5 Assignment
- Week 6 Assignment
- Week 7 Assignment
- Week 8 Assignment
- Week 10 Assignment
- Week 11 Assignment
- Week 12 Assignment
- Week 14 Assignment
Journal Pages
- Anna Horvath Week 2
- Anna Horvath Week 3
- Anna Horvath Week 4
- Anna Horvath Week 5
- Anna Horvath Week 6
- Anna Horvath Week 7
- DrugComboDB Review
- Anna Horvath Week 10
- Anna Horvath Week 11
- Anna Horvath Week 12
- Anna Horvath Week 14
Class Journal Pages
- Week 1 Class Journal
- Week 2 Class Journal
- Week 3 Class Journal
- Week 4 Class Journal
- Week 5 Class Journal
- Week 6 Class Journal
- Week 7 Class Journal
- Week 8 Class Journal
- Week 10 Class Journal
- Week 11 Class Journal
- Week 12 Class Journal
- Week 14 Class Journal
Purpose
To better comprehend how diseases can spread throughout a population, as well as how the transmission of a disease's parameters can be visualized. Furthermore, it will aid in an increased comprehension of the spread of COVID-19, while allowing us an insight into bioinformatics.
Methods/Results
- I watched the video The role of applied math in real-time pandemic response: How basic disease models work.
- I came up with two questions about the video afterwards:
- How can this model's application to the pandemic be made more widely known outside of the scientific community? Is there a way to present this simplified math to help everyone understand the risks of the virus?
- As the pathogenicity of COVID-19 is hard to determine (as we are unaware of how many people are asymptomatic carriers of the virus), how can the model accurately help infer the number with the disease at any given time?
- Read the information on this website. These helped me better understand the following questions:
- If the initial I=0, then there are no people infected with a disease. Therefore, the disease would not be able to spread across the population.
- For the red line (the daily number of infected individuals) to be increasing so rapidly, this means the disease is being spread very rapidly throughout the population. This indicates that it is contagious.
- If the green line also rises rapidly, but not as rapidly as the red, it means that the rate of recovery is quick, but not as fast as the rate of infection is.
- The fact that the green line reaches nearly 1,000 means that of the 1,000 people to be infected, almost all of them recovered. However, twenty people did not recover and passed away from the virus. Only 20 people passing away means that the disease is not very deadly
- Next, I navigated to the interactive SIR model Epidemix.
- I clicked the start button in the middle of the page.
- I selected the type of model I would explore from the drop-down menu on the left, choosing to use "Stochastic Homogenous COMP".
- I chose this model because in stochastic modeling, there is inherent randomness. Although all of the changes that are modeled in the graph are a result of the parameters I set, there would also be some randomness inherent in it. I thought this was interesting, as real life does not follow set parameters and I wanted my model to reflect that.
- I chose to use homogeneous modeling and not heterogeneous. This was so that there would only be one graph created. I wanted the simplicity of only viewing these graphs so that there was not an additional factor besides the inherent randomness.
- I recorded observations about my initial model, then I began manipulating the parameters and seeing how they affected my graphs.
SIR Graphs
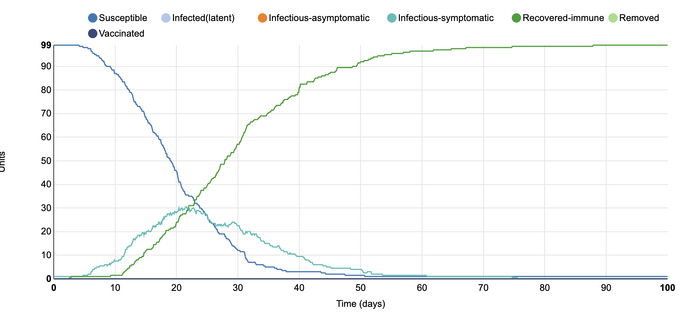
This is the initial SIR model for the Stochastic Homogenous COMP. In this model, the default parameters include a closed population of 100 people. The infectious states include those that are susceptible to the disease, infectious and symptomatic people, and those that are recovered and immune. There is one infected unit at the start of the simulation with 0.4 contacts from each unit. The length of the infectious period is ten days and the type of transmission is frequency-dependent. The length of the simulation is 100 days. This graph shows that only one person was infected at the experiment's start, with everyone else susceptible. Over time, the number of susceptible individuals declined as the number of infected-symptomatic individuals rose. Over time, almost everyone on the graph became recovered-immune. As this graph includes some randomness, the lines are not perfectly smooth as in other simulations. Instead, it depicts a more realistic scenario in which the individuals do not follow a predictable pattern of infection.
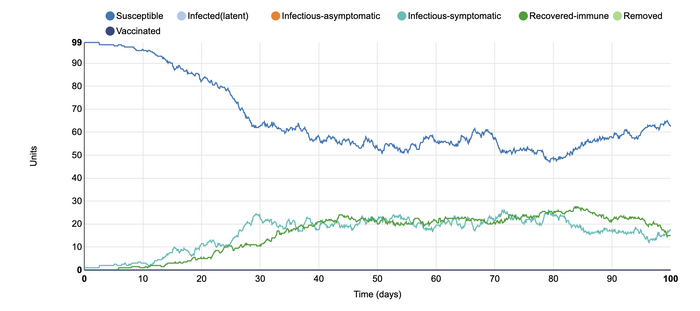
In this model, I changed the population from being closed to being open. I was interested in altering this parameter as I wanted to see how open travel would change the number of infected individuals. At the beginning of the COVID-19 pandemic, I remember the public's outrage at not being allowed to leave the country and travel. However, this graph shows how the rates of infection change over time. Although the number of susceptible individuals stayed the same, the number of infections-symptomatic and recovered-immune remained at nearly the same level for the duration of the simulation. The disease was able to remain in the population for a much longer time at a very steady rate due to the open population conditions. With the ability to travel, rates of infection can increase as many suseptible and infected-symptomatic individuals can interact with each other at a more frequent rate.
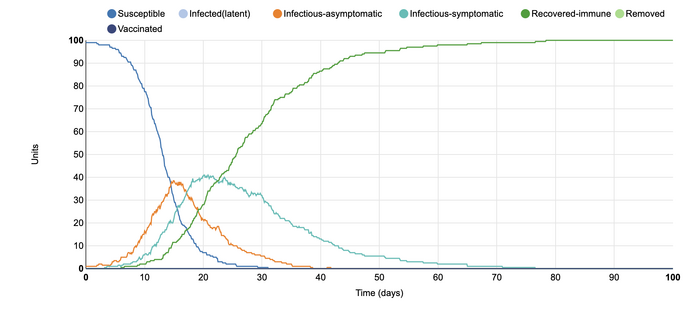
In this model, I added an additional population infection setting of infected-asymptomatic. I did this in order to more closely model the conditions of the COVID-19 pandemic. It is interesting to see how the rates of infection are altered with this additional parameter. With this addition, the time frame of the recovered-immune population shifted. it took longer for the recovery to increase to a higher rate. This is because the infected-asymptomatic population, depicted in orange, increased their numbers first. As they free mingled within the community, they were able to infect the individuals around them without their knowledge. This lead to the infected-symptomatic group to come into the population at a later time. The length of time that the infected-symptomatic population was there also became longer. In this model, it can be seen that infected-asymptomatic individuals within the population can contribute to the rate of illness in the community, even though it may be without there knowledge. It also depicts how they are able to make the timeline of the recovery longer.
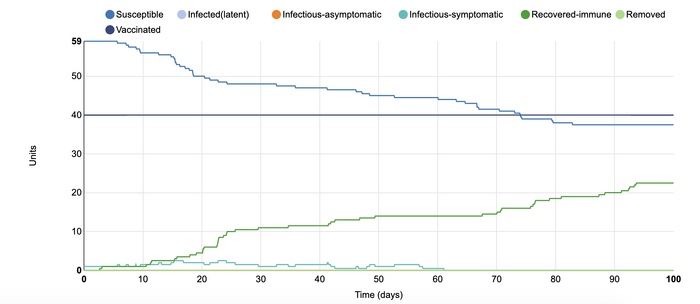
In this model, I added 0.4 units of vaccinated individuals to the populations. I did this in order to see what sort of effect a potential vaccine would have on COVID-19. I have been reading about the progress of creating a vaccine and the increased timeline with which they worked to develop the vaccine fascinates me. This model shows the same number of susceptible individuals in the beginning. However, it is visible that there were many more who were recovered-immune than the number of people who became infected. In this instance, the vaccine was able to successfully 'flatten the curve'. This graph suggests that the vaccine is a very favorable solution in order to control the rates of infection within a population.
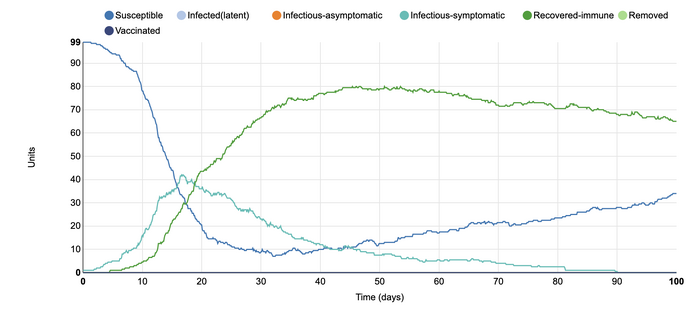
In this model, I changed the parameter regarding recovery. In the initial graph, when an individual recovered, they remained immune for life. However, in this model, they are able to become reinfected. The graph shows that after about sixty days, the number of recovered-immune individuals begins to fall as the susceptible population begins to rise. The infected-symptomatic population does not show as steady an incline as the susceptible individuals do. This makes sense as after a certain amount of time, they can become re-exposed to the disease. However, if they continue to take safety precautions, it is not certain that they will catch it again. Changing the amount of time in which immunity is conferred after the disease caused there to be another incline in the susceptible population, meaning the disease did not have the opportunity to resolve itself within the population. Instead, it is more similar to a cyclic cycle of infection, in which populations can be modeled for their rates of illness over time in more predictable ways.
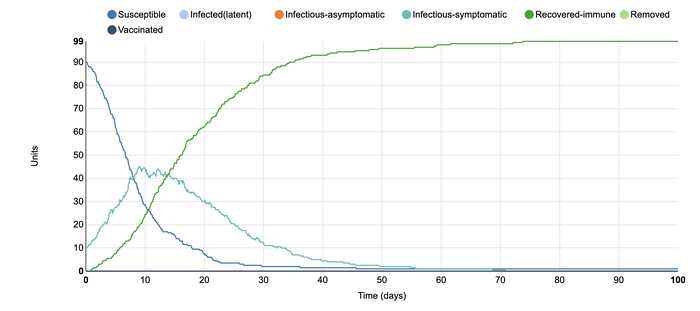
In this model, I changed the number of infected units from the initial 1 unit to 10 units. In this simulation, it can be observed that the number of infected-symptomatic individuals rose more rapidly than in the initial graph. This is because, with more people who can expose others to the disease, it is likelier that more of the population will become infectious-symptomatic. However, this graph also shows that after about 40 days, most individuals were now recovered-immune. This contributes to the idea of flattening the curve,. The medical system can easily be overwhelmed if within this short amount of time such a large amount of individuals became infected. It would become much more difficult to manage the disease within the populations as doctors would have to start deciding who to treat first, leaving the more sick individuals to potentially suffer or die. Ultimately, this is an example of why social distancing is so important right now, as it is necessary for us to control the rate of infected-symptomatic.
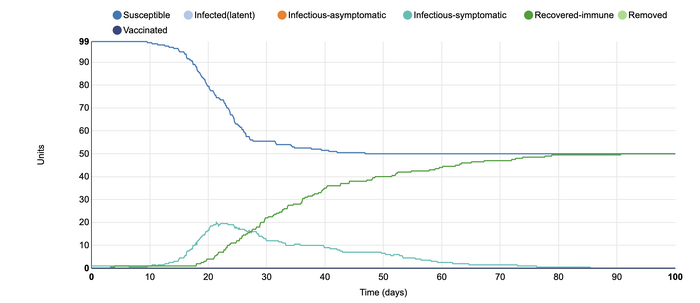
In this model, I changed the number of symptomatic infectious days from the initial ten to fifteen days. This resulted in a much later rise in the infected-symptomatic population than the initial graph. It can be seen that when people are infectious for a longer period of time, the disease appears to spread itself out. It took eighty days for the number of infected-susceptible individuals to become zero, whereas in the first simulation this length of time was only 50 days. The number of individuals who remained susceptible increased and at the end was level with the number of people who were recovered-immune, which is interesting. It appears that there are also fewer infected units within this simulation than the initial one. This could be due to the fact that when a person is infectious-symptomatic for longer, they might be more motivated to remain home.
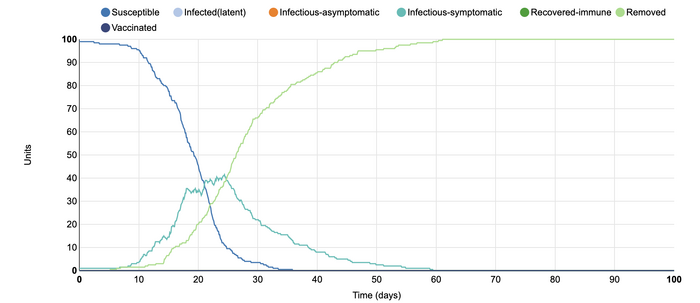
In this model, I added culling as a parameter. In this graph, the infected-symptomatic individuals have been shifted to the left of the graph, meaning it took more time for this to begin. Units were first culled at around the tenth day, when around two individuals were removed. By the end of the simulation, there were no units that were recovered-immune. Instead, the highest line appeared to be those who had been removed. It is interesting to see that culling results in the infection taking longer to occur. Initially, I anticipated this parameter change to merely ensure that people were infected at a much faster rate. However, this graph shows the opposite result.
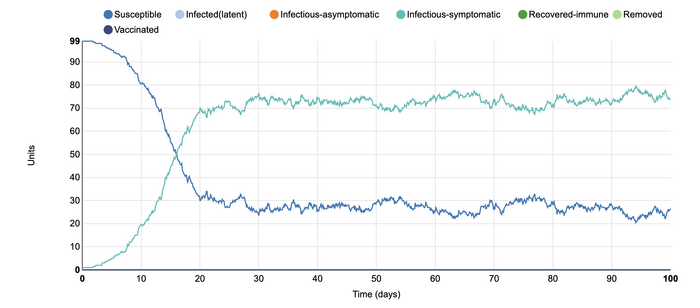
In this model, I took out the ability for units to recover. Instead, the only parameters left are susceptible and infectious-symptomatic. When the infectious period is over in this simulation, all units once again become susceptible. This resulted in the population of infected-symptomatic individuals being much higher than I initially anticipated. It appears that about 25 units were susceptible, as opposed to the near 75 infected at the end of the one hundred days. Interestingly, this graph shows a relatively steady rate of this after the first sixteen days. When the possibility to recover and become immune is removed, the population does not recover to any extent during the simulation.
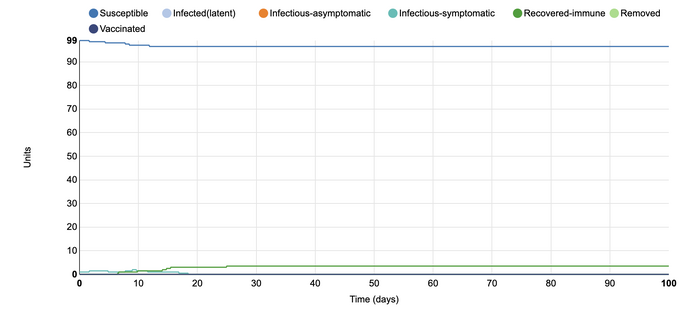
In this model, I changed the number of effective contacts a unit had from 0.4 to 0.1. This decrease in the contacts resulted in only four of the one hundred units catching the disease. All of these units recovered relatively quickly, and after seventeen days, there was no change to the number of people who were infectious-symptomatic. This graph demonstrates why scientists are pushing for social distancing practices to be taken very seriously. With very minimal amounts of contact in a population, it is very unlikely that the disease can be spread at the same capacity. Instead, it allows for individuals to remain protected against the illness. Graphs such as this one are very important for people outside of the scientific community to be made aware of so they can take these precautions more seriously.
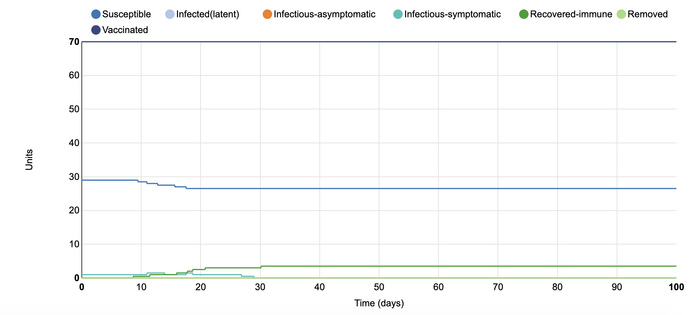
In this model, I added vaccination at 0.8 units. I wanted to see the effect that more vaccination within a population would have. In the first model with vaccination, I added 0.4 units of vaccinated individuals to the populations. That model showed that there were many more who were recovered-immune than the number of people who became infected. In that instance, the vaccine was able to successfully 'flatten the curve'. However, when a larger portion of the population receives a vaccine, the number of infected units did not rise higher than two. The rates were steady throughout the simulation, and vaccination appeared to be able to stop the disease from spreading throughout the units. This shows that if a vaccine comes out for COVID-19, it is very important that as many people receive it as possible. In this way, the rates of further infection can become more controlled as the more individuals are protected, the fewer infectious individuals (whether symptomatic or asymptomatic).
Giordano COVID article
- I looked at Figure 1 of the Giordano et al. (2020) article.
- The authors modified the simple SIR model to take into account the features of the COVID-19 pandemic by adding additional factors to the model. Instead of only reporting those who are susceptible, infected, or recovered, Giordani et al. also take into consideration those who are diagnosed (meaning asymptomatic), ailing (meaning infected but undetected), threatened, healed (recovered), or extinct.
- The public health implications that this model has included the necessity to differentiate between those whose illness is more severe, those who have only a moderate infection or may not even know they are infected, and those whose illness is life-threatening. This model requires that individuals are evaluated on a more holistic basis. It includes the need for greater testing and better understanding the severity of COVID-19's symptoms.
Comic
- I looked at the comic at https://xkcd.com/2355/.
- I found this comic funny because it implies that people who create such models must have had a very stereotypical college experience, where they did little else but model.
Scientific Conclusion
This exercise introduced SIR models, which are important for our understanding of disease transmission amidst this COVID-19 pandemic. Altering the parameters around those who are susceptible, infected, or recovered to a particular disease based on a simulation allowed for a visualization of how the disease can spread and how different parameters may alter this spread. This exercise introduced models in order to help us visualize how different public health measures are very important to follow.
Acknowledgements
- I contacted my homework partner, Owen R. Dailey, one time over text in order to discuss which parameters we were interested in changing.
- I contacted my TA, Annika Dinulos, to ask about proper citation formatting.
- I copied and modified the procedures shown on the Week 2 Page.
- I used the Epidemix website's software in order to generate graphs.
- I copied and modified wiki syntax on formatting a photo from the Media Wiki Help Page.
- Except for what is noted above, this individual journal entry was completed by me and not copied from another source.
Anna Horvath (talk) 19:38, 15 September 2020 (PDT)
References
Epidemix. (2020). Retrieved 16 September 2020, from https://www.epidemix.app/#
Epstein, J., 2008. Why Model?. [online] Jasss.soc.surrey.ac.uk. Retreived September 16, 2020, from http://jasss.soc.surrey.ac.uk/11/4/12.html.bak
Giordano, G., Blanchini, F., Bruno, R., Colaneri, P., Di Filippo, A., Di Matteo, A., & Colaneri, M. (2020). Modelling the COVID-19 epidemic and implementation of population-wide interventions in Italy. Nature Medicine, 26(6), 855-860. doi: 10.1038/s41591-020-0883-7
Help:Images - MediaWiki. (2020). Retrieved September 16, 2020, from https://www.mediawiki.org/wiki/Help:Images#Syntax
OpenWetWare. (2020). BIOL368/F20:Week 2. Retrieved 16 September 2020, from https://openwetware.org/wiki/BIOL368/F
SIR Model. (2020). Retrieved 16 September 2020, from http://www.pandemsim.com/beta/SIRmodel.html
University COVID Model. (2020). Retrieved 16 September 2020, from https://xkcd.com/2355/
Youtube. 2020. The Role Of Applied Math In Real-Time Pandemic Response: How Basic Disease Models Work [Video]. Retrieved 16 September 2020, from https://www.youtube.com/watch?v=Ewuo_2pzNNw&feature=youtu.be&ab_channel=NIMBioS
