Anna Horvath Week 5
From OpenWetWare
Jump to navigationJump to search
Purpose
The purpose of this lab is to explore protein structures and interactions through viewing and manipulating models of ACE2 receptor and the SARS-COV-2 RBD. This will allow us to analyze how amino acid residues in proteins interact with one another.
Methods and Results
Exploring the Spike protein Structure
- Navigated to UniProt Knowledgebase (UniProt KB) to find out what was known about the spike protein of SARS-CoV-2.
- Searched results sing the keyword "SARS-CoV-2" in the main UniProt search field.
- There were 1,616 results that showed up. Eighteen of them were Swiss-Prot, meaning they were manually annotated, while 1,598 were TrEMBL. Not all of these proteins are viral proteins. Some appear to be methyltransferases.
- Used the entry with accession number for P0DTC2. This corresponds to the reference entry for the SARS-CoV-2 spike protein.
- The information provided about this protein in the database entry includes the functions of the spike protein described in detail, links to molecular and biological functions, taxonomic names, the subcellular information, and topology of the SARS-CoV-2 spike protein. It also goes into amino acid modifications, its interactions with other proteins, a photo of the structure. The website also shows the sequence.
- Viewed one of the structures of the SARS-CoV spike protein from Wan et al. (2020) in the NCBI Structure Database using the web-based iCn3D viewer.
- Chose to focus on:
- Figure 1A SARS-CoV RBD (year 2002) complexed with human ACE2: 2AJF
- Chose to focus on:
Figure 1A SARS-CoV RBD Protein Analysis
- When answering the following questions, provide a screenshot pasted into your wiki:
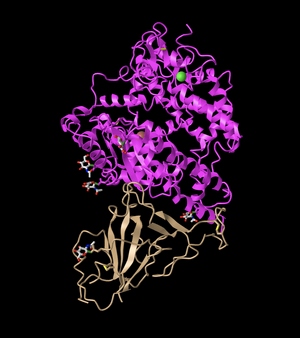
- I created a view of the protein that recreates Figure 2A from the Wan et al. (2020) paper, rotating it to be in the same view as the article.
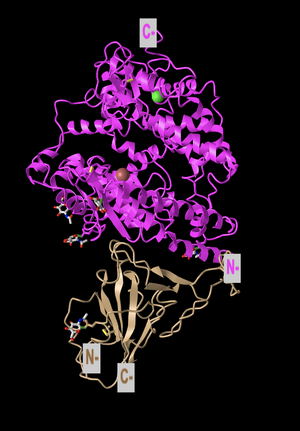
- This image shows the ACE2 protein in pink, while the spike protein is shown in a tan color.
- This is a quaternary structure because it shows two different polypeptide chains interacting, specifically the ACE2 receptor and the SARS RBD domain.
- This structure has two domains. One domain is shown in pink and corresponds to the ACE2 protein, while the other is the SARS RBD domain that is shown in tan in this image.
- I clicked on the Style > Proteins menu and changed the style, including screenshots of each.
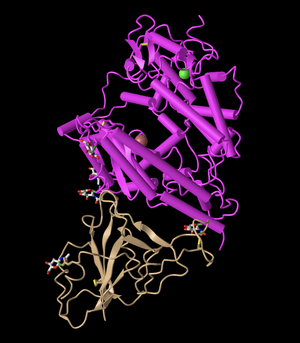
Cylinder and Plate
- First, I clicked on Cylinder and Plate. This style is unique because it changed the alpha-helix structure to a solid cylinder. Meanwhile, the beta-sheets become plates. The cylinders in this image make it easier to visualize the structure, as they are very clearly distinct from the beta-sheets. However, the beta-sheets look similar to before.
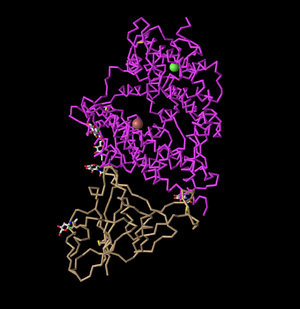
C Alpha Trace
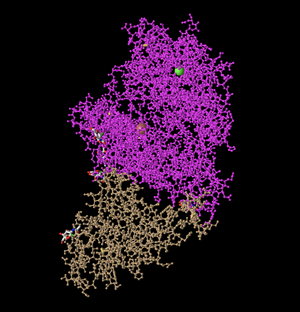
- Next, I clicked on C Alpha Trace under Style. This depicts a series of lines showing the alpha carbons. Therefore, where each 'bend' is visible in the structure, this corresponds to a carbon molecule. This makes it easier to follow the backbone of the protein.
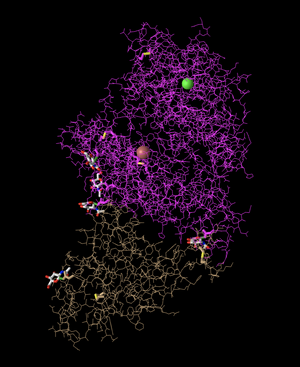
Lines
- I clicked on Lines in order to create this structure. This shows the backbone of the protein, as well as the side chains protruding from it and their relative orientations to each other. Therefore, it follows all of the carbons in the molecule, not just the primary structure backbone.
Ball and Stick
- Next, I clicked on Ball and Stick. This model is similar to the line model, as it shows the backbone of the protein, as well as the side chains protruding from it. However, at the end of each molecule, there is a ball. This gives a sense of the true depth of the molecule, although it makes it difficult to see details.
Spheres
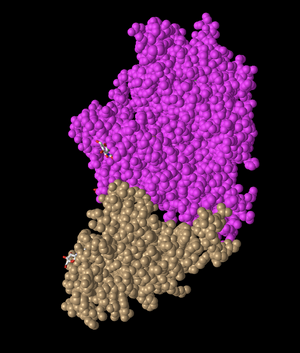
- Then, I changed the setting to Spheres. This shows all of the amino acids clumped together as spheres. It is useful in order to see the protein in a more 3-dimensional manner, as it shows a sense of the protein's density.
Spheres - Spectrum
- In the "Spheres" view, I clicked on the Color menu and showed screenshots of various color schemes.
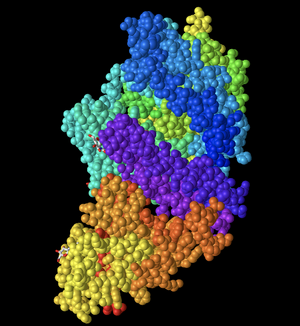
- First, I changed the color to Spectrum. This color scheme is unique because it shows different chains and regions of the protein color-coded into different colors. This was useful in order to better visualize where each region was in the protein and to differentiate between them.
Spheres - Secondary
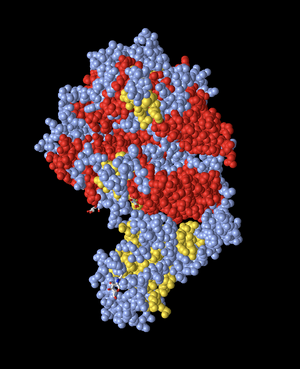
- Then, I changed the color to Secondary. In this image, the sheets are depicted in yellow. The model shows the alpha-helix structures in red, while the beta-sheets are all yellow. This differentiates between the secondary structures within the protein. The rest of the structure is a light blue/gray color.
Spheres - Charge
[[Image:AHFigure9.png] | 300px]
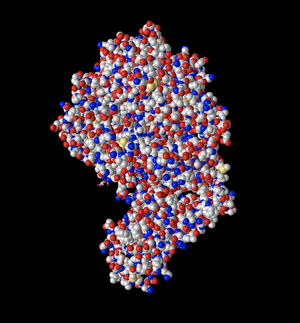
- I changed the Spheres model's color to Charge. This image shows the protein's different charges. Charged molecules are either red or blue. Uncharged molecules are depicted in a grey color. In this image, you can observe the interactions between the different negative or positive charges of the molecule when the red and blue are in close proximity to one another.
Spheres - Atom
- I changed the color of the Spheres model to Atom. This model depicts the specific atoms in different colors. It appears that carbon is gray, nitrogen is red, oxygen is blue, and sulfur is yellow. This model can show the viewer the different types of bonds that may exist between molecules to better understand their interactions.
N and C Terminals
- In order to label the N and C terminals, I clicked Analysis, then Label and made the label size bigger. I also restored the original color and the ribbon figure style.
- The secondary structures found in the ACE2 protein (which is the top protein) can be seen in magenta. This is composed primarily of alpha-helices (as visible from the many coils), however, there are also a few beta-sheets within the protein.
- The secondary structure of the spike protein (the bottom protein) can be seen in the tan color. This is composed primarily of beta-sheets and has some random coils interspersed. This is visible from the loops with arrows seen in the structure, which are a common way of representing beta-sheets.
3SCK Model
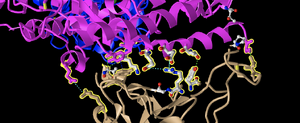
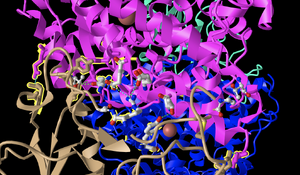
- I looked at the side chain-side chain interactions in the civet ACE2-spike protein structure shown in Figure 4B.
- I interacted with this structure in iCn3D.
- I clicked on the Windows menu to “View Sequences & Annotations”. Then, I clicked on the “Details” tab to show the actual amino acid sequences.
- Of the two sets of ACE2-spike proteins, I focused on the pink and tan chains and oriented them like is shown in Figure 4B.
- In the sequence window, I went to sequence “Protein 3SCK_A” (in pink) and selected the following amino acids: T31, E35, E38, T82, and K353.
- I went to the Styles menu and selected Proteins > Ball and Stick.
- Then, I went to the Color menu and select Atom.
- I then repeated this process for the tan spike protein sequence 3SCK_E for the following amino acids: T487, R479, G480, Y442, and P472.
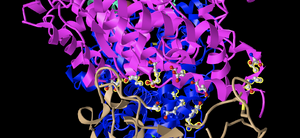
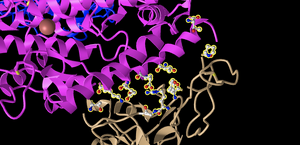
- I took a screenshot oriented like Figure 4B, pictured below in different orientations for clarity.
- E35 on ACE2 makes an ionic bond with R479 on spike protein. Of these amino acids, E35 is the acidic amino acid because it is Glutamic Acid, which has a negative charge. R479 is Arginine, which is a basic, or positively charged amino acid. In the image depicted, we know that the Atom model indicates that carbon is gray, nitrogen is red, oxygen is blue, and sulfur is yellow. Here, we are shown the glutamic acid's oxygen, which often takes a negative charge, in red. meanwhile, the Arginine has a nitrogen in blue. Nitrogen oftentimes can be positively charged.
- T31 on ACE2 makes a hydrogen bond with Y442 on spike protein. T31 is a Threonine, while Y442 is a Tyrosine. Both threonine and tyrosine contain an -OH group, making them both polar amino acids. They are both uncharged amino acids. This can be told from the image as we indicated that the molecule of oxygen is blue, and these amino acid residues both have oxygens in them.
- In order to make dashed lines, I went to the View menu and selected H bonds & Interactions.
- In part 1 of the window, I unchecked “Contacts/Interactions” left Hydrogen Bonds and Ionic Interaction checked.
- In part 2 of the window, I selected the first set “3SCK_A” (pink).
- In part 3 of the window, I selected the second set “3SCK_E” (tan).
- In part 4 of the window, I clicked the button “3D Display”.
- Image below shows a screenshot with dashed lines representing the ionic bonds and H-bonds between the two polypeptide chains and amino acids described above.
Beginning your research project
- Consulting with your partner, answer the following:
- What question will you answer about sequence-->structure-->function relationships in the spike and/or ACE2 protein?
- Does comparing sequences of possible animal reservoirs noted by Wan et al point towards one or more animal reservoirs as being closely related to humans, and therefore make them a good starting point for looking at SARS-CoV-2 lineage?
- What sequences will you use?
- We would use the ACE2 host receptor sequences for humans, bats, civets, mice, rats, pigs, ferrets, cats, orangutans, pangolins (potential intermediary host), dromedary camels, squirrels, mink, turtles, snakes, chickens, fox, and monkeys. This would hopefully result in finding ACE2 receptors most similar to humans, and lend itself to a direction for future research (i.e. looking at coronaviruses which infect these animal reservoirs & comparing them to SARS-CoV-2).
- What question will you answer about sequence-->structure-->function relationships in the spike and/or ACE2 protein?
Scientific Conclusion
In this lab, I learned how to manipulate models in order to visualize amino acid interactions, such as ionic bonds between positively and negatively charged residues, as well as hydrogen bonds between certain residues. I learned how to change models in order to best envision how secondary, tertiary, and quaternary structures of proteins look.
Acknowledgements
- I consulted with my partner Aiden Burnett in class and over text to discuss our independent projects.
- I contacted my TA, Annika Dinulos, to ask about choosing specific amino acid residues on the structure viewing software iCn3D.
- I copied and modified procedures from the Week 5 assignment page.
- I used the Wan et. al - Receptor Recognition by the Novel Coronavirus from Wuhan paper for reference to Figures 1, 2, and 4.
- I explored spike protein model data found on UniProt Knowledgebase (UniProt KB).
- I viewed protein models using the iCn3D viewer.
- I uploaded images using the Wiki Upload page.
- I copied and modified wiki syntax on formatting a photo from the Media Wiki Help Page.
- I browsed the Foldit website and read the blog post.
- Except for what is noted above, this individual journal entry was completed by me and not copied from another source.
Anna Horvath (talk) 21:32, 5 October 2020 (PDT)
References
- Foldit - Blogs. (2020). Retrieved 5 October 2020, from https://fold.it/portal/blog
- Foldit - Solve Puzzles for Science. (2020). Retrieved 5 October 2020, from https://fold.it/portal/
- iCn3D: Web-based 3D Structure Viewer 2AJF. (2020). Retrieved 5 October 2020, from https://www.ncbi.nlm.nih.gov/Structure/icn3d/full.html?&mmdbid=35213&bu=1&showanno=1
- iCn3D: Web-based 3D Structure Viewer 3SCK. (2020). Retrieved 5 October 2020, from https://www.ncbi.nlm.nih.gov/Structure/icn3d/full.html?pdbid=%203SCK
- OpenWetWare. (2020). BIOL368/F20:Week 5. Retrieved 5 October 2020, from https://openwetware.org/wiki/BIOL368/F20:Week_5
- Uniprot. (2020). S - Spike glycoprotein precursor - Severe acute respiratory syndrome coronavirus 2 (2019-nCoV) - S gene & protein. Retrieved 5 October 2020, from https://www.uniprot.org/uniprot/P0DTC2
- Wan, Y., Shang, J., Graham, R., Baric, R., & Li, F. (2020). Receptor Recognition by the Novel Coronavirus from Wuhan: an Analysis Based on Decade-Long Structural Studies of SARS Coronavirus. Journal Of Virology, 94(7). doi: 10.1128/jvi.00127-20
Template
User Pages
Assignments
- Week 1 Assignment
- Week 2 Assignment
- Week 3 Assignment
- Week 4 Assignment
- Week 5 Assignment
- Week 6 Assignment
- Week 7 Assignment
- Week 8 Assignment
- Week 10 Assignment
- Week 11 Assignment
- Week 12 Assignment
- Week 14 Assignment
Journal Pages
- Anna Horvath Week 2
- Anna Horvath Week 3
- Anna Horvath Week 4
- Anna Horvath Week 5
- Anna Horvath Week 6
- Anna Horvath Week 7
- DrugComboDB Review
- Anna Horvath Week 10
- Anna Horvath Week 11
- Anna Horvath Week 12
- Anna Horvath Week 14
