AninditaVarshneya BIOL368 Week 3
Electronic Lab Notebook
Purpose
The purpose of this activity is to become familiar with ClustalW and to practice using the Biology Workbench. This activity also served as an opportunity to work with the paper that we will ultimately be using for journal club next week.
Methods and Results
Activity 1: Part 2
- Go to the NCBI website URL.
- Search for the paper title in the search bar.
- Click on the results from PubMed.
- From the abstract page, select "Nucleotide" from the Related Information section.
- We selected the first GenBank record that appeared with the accession number: AF016768.2
- This record came from subject 1, visit 1, clone 9. Information about who the sample was collected from can be found under the "Definition" section in the full record.
- The FASTA sequence can be found by clicking on the FASTA link immediately underneath the GenBank accession number.
- Return to the summary view of records and select 5 using the check boxes.
- Select the "Send to" menu option in the top right corner of the page.
- Select the "File" option.
- Select the FASTA format and leave the "Sort by" at it's default setting. Select "create file."
- Open the document using TextEdit (or your machines standard text editor) and confirm it is in the FASTA format.
- FASTA format has each sequence proceeded with a greater than sign followed by a label for the sequence.
Activity 1: Part 3
- Go to Biology Workbench
- Create an account by selecting "register for free."
- Scroll down to the buttons that describe different tool options and select "Nucleic Tools."
- We are using "Nucleic Tools" because the FASTA data is nucleic acid data.
- I also selected the Rose color because I thought it would be more aesthetically pleasing.
- Select "Add New Nucleic Sequence" from the list of tools and hit the "Run" button at the bottom of the frame.
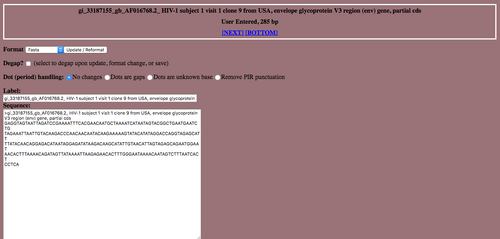
- Select "Choose File" and find and select the .fasta file you saved with all of the sequences. Select the "Upload File" button.
- All five sequences should have appeared in five separate "Label" and "Sequence" pairs.

- Select the "Save" button from the navigation bar. This will import the data into the Biology Workbench.
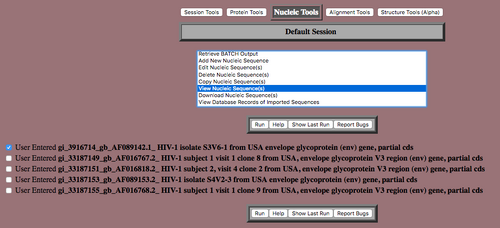
- All of the sequences should appear in a list with checkboxes next to them.

- Select one of the sequences via the check box, and scroll through the list of tools until you see "View the Sequence(s)." Select that option to confirm that the sequences were imported correctly. Select "Run" to view the sequences.
- Find the ClustalW tool and select "Help."
- ClustalW is a tool that aligns multiple sequences of protein and nucleic acids.
- Scroll to the bottom of the page and select the "Return" button.
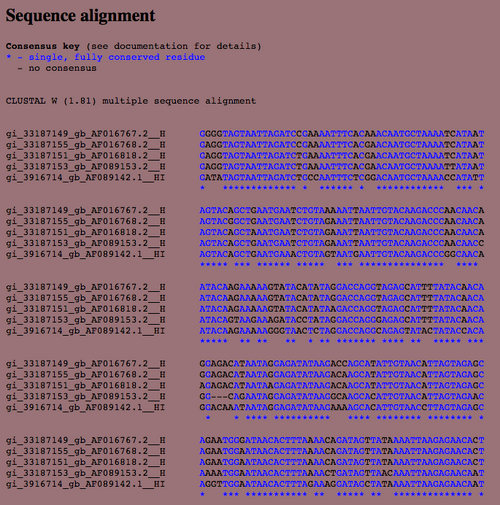
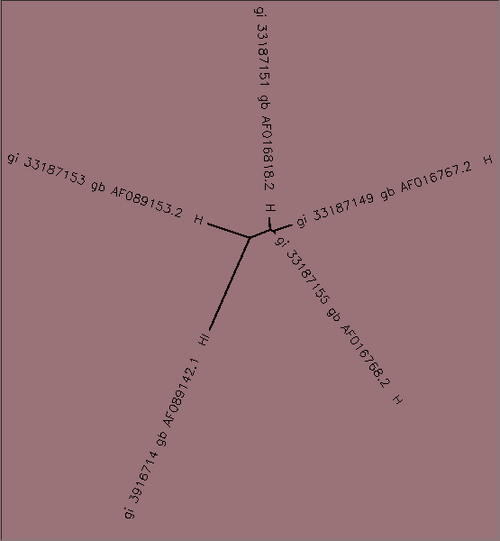
- Use the "Select All Sequences" tool to select all of your sequences and hit "Run." Then, select the ClustalW tool and hit "Run" to align all of the sequences. Make sure the guide tool display is set to "Unrooted Tree" and hit submit.
- The next page provides the following information:


Conclusion
The procedures outlined in Activity 1 of the Exploring HIV Evolution: An Opportunity for Research outlined the process of analyzing nucleic acid data from a published paper using publicly available resources such as Biology Workbench and ClustalW. Because the next few weeks of this lab will be focused on researching the envelope protein of HIV, it is essential that the data provided by other researchers is easily accessed and used, a lesson that this activity clearly outlined. Furthermore, by creating an account and using resources such as ClustalW in Biology Workbench, we gained familiarity with using online tools for nucleic acid sequence analysis. The ClustalW trees provide insight about which strains are more closely related to each other. This is determined by analyzing the length of the lines connecting each of the strains where the longer the internal branch, the less related the strains are. Ultimately, this activity met its purpose to set up the lab for the following weeks of HIV research and introducing us to different tools we may find useful as we try to analyze data presented in Markham et al., 2016.
Data and Files
Journal Club Preparation
Vocabulary
- seroconvertion
- "The stage in an immune response when antibodies to the infecting agent are first detected in the bloodstream. For example, people infected with HIV typically seroconvert about 4–6 weeks following the initial infection, when antibodies against viral proteins are first produced."
- http://www.oxfordreference.com/view/10.1093/acref/9780199204625.001.0001/acref-9780199204625-e-6465?rskey=BmyP0x&result=4631
- coreceptor
- "A receptor molecule on the surface of a cell that enhances the activity of another receptor following binding of its extracellular ligand."
- http://www.oxfordreference.com/view/10.1093/acref/9780199204625.001.0001/acref-9780199204625-e-6175?rskey=Ebjssa&result=1141
- restriction enzyme
- "A type of enzyme that can cleave molecules of foreign DNA at a particular site."
- http://www.oxfordreference.com/view/10.1093/acref/9780199204625.001.0001/acref-9780199204625-e-3849?rskey=RrVxj0&result=1
- monophyletic
- "In systematics, describing a group of organisms that contains all the descendants of a particular single common ancestor."
- http://www.oxfordreference.com/view/10.1093/acref/9780199204625.001.0001/acref-9780199204625-e-2834?rskey=oteg0J&result=2531
- synonymous mutation
- "an alternative name for silent mutation"
- http://www.oxfordreference.com/view/10.1093/acref/9780198529170.001.0001/acref-9780198529170-e-19109?rskey=W0GhhC&result=1
- nested PCR
- "the primers used in the first round of amplification are either both replaced (nested PCR) or only one is replaced (semi-nested PCR) for the second and subsequent cycles of amplification. Increases the sensitivity and specificity of the PCR."
- http://medical-dictionary.thefreedictionary.com/nested+PCR
- hypervariable region
- "a chromosomal segment characterized by multiple alleles within a population for a single genetic locus."
- http://encyclopedia.thefreedictionary.com/Hypervariable
- epitope
- "the part of an antigen that is recognized by the immune system, specifically by antibodies, B cells, or T cells."
- http://encyclopedia.thefreedictionary.com/epitope
- nested primers
- "amplification of an AMPLICON by using PRIMERS (nested primers) internal to the original primers used to generate that amplicon."
- http://medical-dictionary.thefreedictionary.com/nested+pcr
- peripheral blood cells (in context of peripheral blood mononuclear cells)
- "Peripheral blood cells are the cellular components of blood, consisting of red blood cells, white blood cells, and platelets, which are found within the circulating pool of blood and not sequestered within the lymphatic system, spleen, liver, or bone marrow."
- http://encyclopedia.thefreedictionary.com/peripheral+blood+cell
Outline
Introduction
- In stable environments, a virus adopts a "best fit" state
- Mutations that survive are of a particular type
- In dynamic environments similar to those of the HIV-1, virus does not adopt to "best fit" state
- Adapt to changing environment with high levels of competence for mutation
- Variation in genetic mutations in HIV-1 created by regulation of coreceptors
- If a variety of genetic variations attacked indiscriminately, we would have fewer types of variants, and the surviving variants would most likely be the most numerous prior to the attack
- If immune response attacks most abundant genetic variant, several different variants would survive (maintain diversity)
- Overall number would decrease, but in some cases a large variety of mutations exist
- Only getting rid of the most common virus still leaves several others in a fair population size
- Surviving variants would continue to replicate and mutate therefore maintaining or even increasing genetic diversity of the virus
- Using this idea, this study plans to study the patterns of diversity in the HIV-1 virus to determine it's method of adapting to attacks from the body
- Previous studies of HIV-1 genetic diversity not at the scale of this research project
- Used small number of people, characterized HIV-1 genetics without using DNA sequence, or only collected data from a small number of time points throughout the study
Methods
- The Study Population
- 15 participants from injection drug users
- Participate in AIDS Linked to Intravenous Experiences (ALIVE) study
- Blood was collected from participants every 6 months for virologic and immunologic studies
- All participants had different levels of CD4 T-cell serum levels
- Rapid progressors have <200 CD4 T cells
- Moderate progressors have 200-650 CD4 T cells
- Nonprogressors have >650 CD4 T cells throughout the study
- 15 participants from injection drug users
- Sequencing of HIV-1 env Genes
- 285-bp portion of env gene replicated using nested PCR from recently infected, unactivated peripheral blood mononuclear cells (PBMC)
- PBMC genetic data does not last for very long after becoming infected, so should be related to genetic information of the virus
- Sequences amplified through PCR and then stored for analysis at 4 degrees Celcius
- Replicated sequences were then made into pUC19 using "standard methods" (the paper did not disclose methods)
- Then sequenced using Sanger method
- Another round of limiting dilution PCR completed (some samples underwent more than one round)
- Results indicated that each sample must have come from a separate viral genome template specific to its own strain
- Plasma Viral Load
- Determined with reverse transcription-PCR
- Generation of Phylogenetic Trees
- Created using MEGA computer package with "neighbor-joining algorithm" and Tamura-Nei distance measuring protocols
- Labels indicate clone number, subject number, and visit number
- Tree is color coded according to time point at which genetic data was collected
- Clones of each subject were found to be independent of the original samples with the exception of data associated with S1 and S2 (known to be related)
- Correlation Analysis
- To determine correlation between time point and genetic diversity, two variables were compared
- X0 represented diversity/ mutational divergence
- Y1 represented CD4 T cell count after 1 year of testing
- Y1 was stratified to determine how values of X0 were affected
- Determination of dS/NS Ratios
- Data was compared for each sequence with every other sequence
- Differences between strains were categorized as synonymous or nonsynonymous
- Resulting values of dS and NS were averaged among all strains (used median because averaged numbers appeared skewed)
- Data was compared for each sequence with every other sequence
- Examination of Source of Greater Initial Visit Diversity in Subject 9 and 15
- High genetic variation between subject 9 and 15, hypothesized that may be infected with more than one strain of the virus
- Phylogenetic trees were created between subject 9 and 15 strains and 150 of other random subject's strains
- Subject 9 and 15 both grouped monophyletically
- Reconforimed that subjects 9 and 15 were HIV-1 seronegative 7 months prior to the study
- Comparison of Rate of Change in Divergence and Diversity
- Each individual was matched with a regression line between divergence and diversity
- Averages of the slope compared with "random effects models" (models with random data (?))
Results
- Patterns of CD4 decline not consistent across all participants in the study
- No significance between viral load data of moderate progressors and rapid progressors, but significance between both of those groups and nonprogressors
- Changes in HIV-1 sequence at V3 (hypervariable) domain calculated according to genetic diversity and divergence
- Rate of change in diversity changed from -2.94 to 5.10 nucleotides per clone
- Viruses from initial visits for 13/15 subjects were homogenous - subject 9 and 15 were heterogenous, and therefore suspected to be infected by two different strains
- Further analysis did not match with this hypothesis
- Diversity and divergence increased over time
- Rapid progressors had a significantly higher rate of diversity/divergence than nonprogressors
- Rapid progressors and moderate progressors did not have significantly different rates of diversity/divergence
- Moderate progressors had a significantly higher rate of diversity/divergence than nonprogressors
- Diversity and divergence were negatively correlated with CD4 T cell count after 12 months of the study
- Increased diversity/divergence therefore implied decreased CD4 T cell counts in the next year
- dS/NS ratio was near 1 for subjects with random mutation with no selection
- Moderate and rapid progressors had a significantly different dS/NS ratio than nonprogressors
- Nonprogressors showed a trend towards selecting against NS mutations
- Phylogenetic trees showed predominance of a single strain except for subjects 10 and 15
- Factors that support mutations in early viruses potent enough to select against clones of stains
Discussion
- Higher levels of genetic diversity and divergence was correlated with decreased levels of CD4 T cell counts over time
- Subjects with similar counts of CD4 T cells but increased counts of clones had even more decreased levels of CD4 T cell counts than the others
- Nonprogressors showed selection against amino acid changes while both moderate and rapid progressors did not
- Two other studies provided conflicting data:
- McDonald et al. found same association between genetic divergence and CD4 T cell counts, but had conflicting data at second time point where slow progressors had higher diversity than rapid progressors
- Most likely because fewer time points checked and subjects were not tested from the moment of seroconversion
- Wolinsky et al. found less diversity in rapid progressors and slow progressors
- The subjects that most supported this finding may have been the exception
- McDonald et al. found same association between genetic divergence and CD4 T cell counts, but had conflicting data at second time point where slow progressors had higher diversity than rapid progressors
- Finding of the paper most consistent with findings of Nowak
- Increased genetic diversity and divergence means decreased CD4 T cell counts
- Nowak hypothesized: increased diversity means clones develop epitopes that cannot be attacked by the immune system
- This hypothesis implies that at some point there would be a decrease in diversity once T cell counts max out
- In order to overcome the virus, the whole organism must overcome it
Assigned Questions
- What is the importance or significance of this work?
- This study observed the relationship between genetic diversity and divergence through mutations to determine if/how they were correlated with the progression of the HIV-1 virus. It was found that increased genetic diversity/divergence makes the HIV-1 virus progress quicker, but the extent to which is unknown to the authors of this paper.
- What were the limitations in previous studies that led them to perform this work?
- The previous studies mentioned by the paper were found to have the following problems: not enough participants from which to collect a variety of blood samples, not enough time points used to collect these samples to truly get a full picture, and making assumptions about the genetics of the HIV-1 virus without using any sequencing techniques.
- How did they overcome these limitations?
- The authors of this paper overcame these limitations by using 15 participants, and numerous time points (at least every 6 months over a 2 year span), and they used known sequencing methods to collect information about mutations within each genetic sequence (Sanger method)
- What is the main result presented in this paper? (Hint: look at the last sentence of the introduction and restate it in plain English.)
- The main result presented in the paper is that an increase in genetic diversity and divergence means a decrease in CD4 T cell counts, and a progression of the virus.
- What were the methods used in the study?
- This study used methods including sequencing using the Sanger method, multiple forms of polymerase chain reactions (PCR), production of phylogenetic trees with normalization using the Tamura-Nei distance algorithm, and correlation analysis among others.
- Briefly state the result shown in each of the figures and tables.
- Figure 1: Subject 1 had a diversity value different from all of the other subjects after seroconversion. Aside from that, the figure provides a basic overview of diversity, divergence, and CD4 T cell counts across each of the participants in the study.
- Table 1: Despite inconsistent results within some subjects regarding CD4 T cell counts, the lowest CD4 T cell counts were used to categorize the participants into either rapid progressor, moderate progressor, or nonprogressor. Overall, this table provides and overview of all statistical data collected from each of the participants.
- Figure 2: A. Rapid progressors had a much higher trend of average increase in genetic diversity as compared to the other groups, but statistical significance was not indicated on the figure itself. The rapid progressors group also had the largest range of average percent changes in diversity as shown with the large error bars. B. As the rate of progression increases, a relative increase in average percent mutation of nucleotides occurs, but there is no indication of the statistical significance of this data within the figure or the figure caption.
- Figure 3: Subject 9 has a single mutation despite the hypotheses that its heterogenousity may be the result of multiple strains having infected the subject. This was shown through the horizontal distance between S9V2-1 and S9V2-2
- Figure 4: Subjects all had single mutations between samples, and were not consistently along the same branch in the phylogenetic trees. The figure presents this data with four randomly selected phylogenetic trees of different subjects.
- How do the results of this study compare to the results of previous studies (See Discussion).
- The results of this study differ from two previous studies published by McDonald et al. and Wolinsky et al. but the authors attribute these differences to not enough data and the subjects being an exception of the general trends found. The author then cites a third paper by Nowak with very similar results. The author goes on to compare the hypothesis for why the results were the same presented by Nowak to his/her own data and ultimately states that it applies.
- How do the results of this study support published HIV evolution models?
- This study supports the results published HIV evolution models with its findings that the increased genetic diversity ultimately leads to the progression of the virus. This matches the idea presented in the introduction that some viruses adapt to a dynamic environment by allowing the immune system to attack the variant that is highest in count but maintaining a wide diversity of variants. The large diversity of variants is ultimately what causes/allows for the progression of the HIV-1 virus.
- What are the limitations in this study? (your critical evaluation of the study).
- The most glaring limitation in this study is that all participants belong to the ALIVE program. While this allowed for a regularity with the participants, this data only includes information from participants who contracted HIV through intravenous drugs. Because all participants were members of a potentially isolated population, this data may not be representative of all HIV patients. Furthermore, even though 15 participants is more than the number of participants used by other publications, that is still a small population size considering the vastness of the virus.
- What future work do you suggest?
- In the future, the authors could address both of the previously stated short comings by recruiting participants blindly through surveys across several different populations that may have contracted HIV. On that note, participants should be from varying sexualities, genders, and ethnic backgrounds, and that information should be stated within the publication. Furthermore, the authors should consider a larger number of participants so they can more confidently discourage the findings of Wolinsky et al. and supporting their claim that some of the subjects were truly just exceptions to the general trends. Ideally, because they would be reaching out to a larger population than just members of the ALIVE program, this can be addressed by addressing the previous problem.
Acknowledgements
Thank you Avery Vernon-Moore for working with me on the procedures outlined above. While I worked with the people noted above, this individual journal entry was completed by me and not copied from another source. -- Anindita Varshneya 02:09, 18 September 2016 (EDT)
References
- Donovan S and Weisstein AE (2003) Exploring HIV Evolution: An Opportunity for Research. In Jungck JR, Fass MR, and Stanley ED, eds. Microbes Count! West Chester, Pennsylvania: Keystone Digital Press.
- Markham, R.B., Wang, W.C., Weisstein, A.E., Wang, Z., Munoz, A., Templeton, A., Margolick, J., Vlahov, D., Quinn, T., Farzadegan, H., & Yu, X.F. (1998). Patterns of HIV-1 evolution in individuals with differing rates of CD4 T cell decline. Proc Natl Acad Sci U S A. 95, 12568-12573. doi: 10.1073/pnas.95.21.12568
- Vlahov, D., Anthony, J.C., Munoz, A., Margolick, J., Nelson, K.E., Celentano, D.D., Solomon, L., Polk, B.F. (1991). The ALIVE study, a longitudinal study of HIV-1 infection in intravenous drug users: description of methods and characteristics of participants. NIDA Res Monogr 109, 75-100.
- Week 3 Assignment Page
Other Links
User Page: Anindita Varshneya
Bioinfomatics Lab: Fall 2016
Class Page: BIOL 368-01: Bioinfomatics Laboratory, Fall 2016
| Weekly Assignments | Individual Journal Assignments | Shared Journal Assignments |
|---|---|---|
|
|
|
SURP 2015
Links: Electronic Lab Notebook