Lucia I. Ramirez Week 9
Return to user page:Lucia I. Ramirez
Click here for assignment instructions.
Discovery Questions from Chapter 4
The following questions are related to Chapter 4 of Campbell & Heyer (2003). Note that some of the questions below have been reworded from the Discovery Questions in the book:
(Question 5, p. 110)
Choose two genes from Figure 4.6b (below) and draw a graph to represent the change in transcription over time.

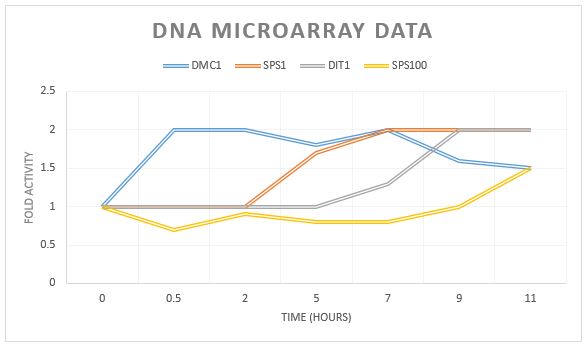
The fold intensity is described as follows:
fold repressed : values greater than 1 indicate a 20-fold repression
1:1 ration is at 1 where there is no change in transcription
fold induced : values less than 1 indicate a 20-fold induction
(Question 6b, p. 110)
Look at Figure 4.7 below, which depicts the loss of oxygen over time and the transcriptional response of three genes. These data are the ratios of transcription for genes X, Y, and Z during the depletion of oxygen. Using the color scale from Figure 4.6, determine the color for each ratio in Figure 4.7b. (Use the nomenclature "bright green", "medium green", "dim green", "black", "dim red", "medium red", or "bright red" for your answers.)

(Question 7, p. 110)
Were any of the genes in Figure 4.7b transcribed similarly? If so, which ones were transcribed similarly to which ones?
Yes. Gene Z was similar to SPS1 and DIT1 going from black (1) to a stronger red (2).
(Question 9, p. 118)
Why would most spots be yellow at the first time point? I.e., what is the technical reason that spots show up as yellow - where does the yellow color come from? And, what would be the biological reason that the experiment resulted in most spots being yellow?
(Question 10, p. 118)
Go to the Saccharomyces Genome Database and search for the gene TEF4; you will see it is involved in translation. Look at the time point labeled OD 3.7 in Figure 4.12, and find the TEF4 spot. Over the course of this experiment, was TEF4 induced or repressed? Hypothesize why TEF4’s change in expression was part of the cell’s response to a reduction in available glucose (i.e., the only available food).
(Question, 11, p. 120)
Why would TCA cycle genes be induced if the glucose supply is running out?
(Question 12, p. 120)
What mechanism could the genome use to ensure genes for enzymes in a common pathway are induced or repressed simultaneously?
(Question 13, p. 121)
Consider a microarray experiment where cells deleted for the repressor TUP1 were subjected to the same experiment of a timecourse of glucose depletion where cells at t0 (plenty of glucose available) are labeled green and cells at later timepoints (glucose depleted) are labeled red. What color would you expect the spots that represented glucose-repressed genes to be in the later time points of this experiment?
(Question 14, p. 121)
Consider a microarray experiment where cells that overexpress the transcription factor Yap1p were subjected to the same experiment of a timecourse of glucose depletion where cells at t0 (plenty of glucose available) are labeled green and cells at later timepoints (glucose depleted) are labeled red. What color would you expect the spots that represented Yap1p target genes to be in the later time points of this experiment?
(Question 16, p. 121)
Using the microarray data, how could you verify that you had truly deleted TUP1 or overexpressed YAP1 in the experiments described in questions 8 and 9?
Back to User page: Lucia I. Ramirez
Journals/Assignments
Week 1
Week 2
Week 3
Week 4
Week 5
Week 6
- Assignment
- Week 6 Individual Journal Not Assigned
- Class Journal Entry
Week 7
Week 8
Week 9
Week 10
Week 11
Week 12
Week 13
Week 14
Week 15
