ISEEM Progress September 2010
| Home | Project | People | News | For Team | Calendar | Library |
I. Progress made toward completion of our goals
A. Personnel
- Green Lab: James O'Dwyer moved to Santa Fe Institute.
- Pollard Lab: no changes
- Eisen Lab: no changes
- Wu Lab: no changes
B. Research
Eisen lab
Phylogenetic Linkage Estimation in Metagenomes
Aaron Darling continued developing and characterizing the Bayesian approach to determining which short sequence reads in a next-generation metagenome come from the same species or cohesive genetic unit. This was previously called cobinning. The method was evaluated on simulated datasets consisting of reference taxa and metagenome taxa where the taxa were selected to maximize phylogenetic diversity. Thus the reference taxa are maximally different from each other and also from the metagenome taxa. We are interested in this simulation design because it may reflect current reference genome sampling strategies (GEBA) and the large diversity of as-yet-unsampled organisms. Short (70 bp) paired-end sequencing reads were simulated to <1x coverage for most organisms. This scenario represents a worst case scenario for the methodology. Nonetheless, we found that the performance of the method increases slowly with increasing number of reference taxa, until finally saturating around 90% sensitivity and 95% specificity. The method has also been applied to some real datasets, including a BGI gut sample and the HOT ALOHA sample. These results are currently being analyzed by Steve Kembel.
Protein family evolution
Dongying Wu has continued to work on characterizing and classifying protein families. The latest work in this area, which is in progress, involves examining the relationship between phylogenetic diversity (of rRNA and/or other phylogenetic markers) and the degree of protein family novelty present in a genome. More specifically, in a follow up to the work present in 2009 in the "Genomic Encyclopedia" paper, we are now looking at the rate of recovery of new protein families per genome throughout the tree of life.
Determining function of unknown gene families
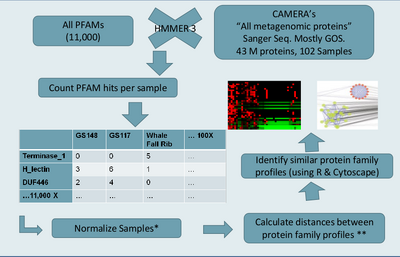
Morgan Langille is interested in seeing if protein families that co-occurred with the same frequency across many metagenomic samples have similar function. If these families do have similar function then we could develop a method for determining the function of protein families of unknown function. This method is referred to as "community profiling" since it is similar to "phylogenetic profiling". The general approach, also described in previous progress reports, is outlined in figure "Community Profiling Pipeline".
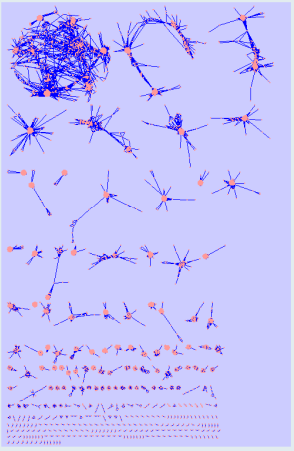
We used HMMER 3 to scan 42 million proteins from the GOS dataset against all 11,000 PFAMs, producing a large data matrix of PFAM counts for each GOS sample. Each pair of PFAMs can then be compared based on their count profiles across samples. Several measurements were to used to calculate the (dis)similarity between each pair of PFAMs, including Pearson's correlation, Sorenson beta-diversity, and others. Using a high similarity cutoff (>0.9 correlation), we visualized the resulting clusters of PFAM with similar patterns of occurrence across samples in Cytoscape (see Figure:PFAM Metagenomic Profile Clusters).
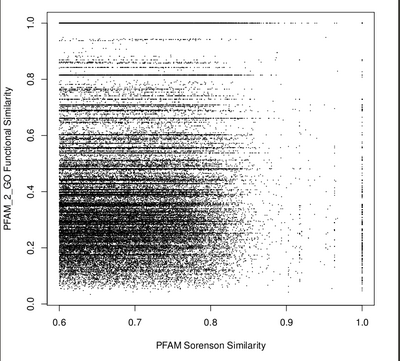
To measure how well the protein families were clustering together, we had to determine a way to score how similar pairs of PFAMs are functionally. Therefore, we mapped PFAMs to GO terms using PFAM2GO and then used a tool called GO SESAME that uses the GO hierarchy to determine a function score (ranging from 0 to 1). Functional similarity scores were calculated for each pair of PFAMs and these scores were plotted vs the "community profiling" distance (used in the clustering). We tested for correlation between functional similarity and community profiling similarity. Unfortunately, there doesn't appear to be a clear trend that shows that the community profiling metric is pulling out protein families with similar function (see Figure: Community Profiling vs Function Similarity). This weak correlation may be due to noise in the metagenomic measurements (e.g., sampling variability).
We are thinking about ways to account for this noise and potentially uncover a stronger functional signal in the community profiles. One idea is to subtract the taxonomic signal from the PFAM count data. This would involve first figuring out what species are present and then down-weighting those protein families that occur in abundant species.
The PFAM vs GOS samples matrix produced by this project is also is being used for other research, such as calculating alpha and beta diversity among GOS samples using PFAM counts instead of traditional 16s/species counts. These results will be compared and contrasted with Steve Kembel's diversity measurements on the same samples using species counts.
Bioinformatics support
Guillaume Jospin downloaded, organized and filtered data sets for 16S and metagenomic RNA studies from SILVA, megX and mg-rast (sequences and meta data). All sets area available on Edhar as flat files and the SILVA and MegX data is also stored in a MySQL format.
The marine microbial range maps group was provided with taxonomy data using the RDP website for the samples they selected out of the megX data set.
Work on the protein families is under going a quality control assessment. Using the hmmer3 package we are interested to see if the sequences used to build the families get matched to the families they are supposed to belong to. Dealing with such large amount of data is suspected to take a couple weeks to complete.
Green Lab
Using phylogenetic marker genes to measure phylogenetic diversity from metagenomic data
In collaboration with Guillaume Jospin and other iSEEM collaborators, Steve Kembel applied the phylogenetic marker gene candidates identified by Dongying Wu to the GOS data set, identifying an additional 839,000 sequences from 116 bacterial and archaeal phylogenetic marker gene families from the metagenomic data.
After an evaluation of different approaches for phylogenetic inference, we are currently employing the short-read placement algorithms implemented in RAxML and pplacer to construct metagenomic phylogenies from these data. In collaboration with Aaron Darling (see above), we are in the process of comparing the novel approach for binning metagenomic sequences into groups with the results of previously employed methods for placing metagenomic reads onto reference phylogenies used in our study of phylogenetic diversity in the HOT ALOHA data set, and if the novel method performs well we will re-analyze the GOS data using this method.
We have optimized code in the picante software package to allow the analysis of the resulting very large phylogenetic trees. We are currently in the process of re-analyzing the data using these methods, but our results are similar to those reported previously, namely that we found highly consistent patterns of phylogenetic diversity along environmental gradients in the GOS data set, with the same environmental variables explaining most variation in phylogenetic beta diversity across all 31 gene families.
In collaboration with Morgan Langille and Tom Sharpton, we are currently comparing patterns of alpha and beta diversity estimated for the GOS samples based on these phylogenetic diversity estimates with diversity measured based on 16S taxonomic diversity and PFAM functional diversity. These analyses are in the early stages.
16S copy number estimation
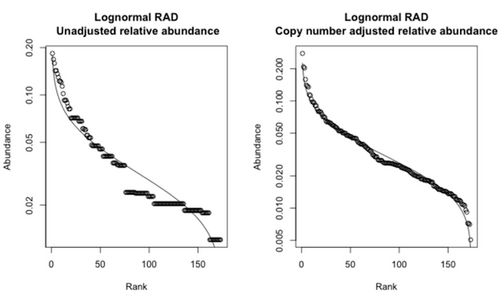
In collaboration with Martin Wu and Jonathan Eisen, Steve Kembel is developing a method that uses phylogenetic comparative methods to estimate genomic copy number of the 16S SSU-rRNA gene for environmental sequences and OTUs. This method will allow 'correction' of estimates of relative abundance for 16S OTUs from environmental sequencing. The results to date indicate that we can accurately estimate copy number for environmental sequences, and that adjusting copy number in this way can lead to major changes in the ecological inferences that are drawn from empirical data sets. We are currently preparing a manuscript describing these results.
Niches and Environmental Gradients
James O'Dwyer continued to adapt a set of tools from theoretical and statistical physics known as field theory, and developed these tools into a theoretical framework for community ecology. So far, we have explored two distinct applications of these methods: communities structured by body-size (O'Dwyer et al (2009) PNAS) and communities structured by space (O'Dwyer & Green (2010) Ecology Letters).
These applications have focused on how the properties of individual organisms (for example metabolic rate, or dispersal capability) feed into community-level patterns, and we have since been developing theory to include the effects of environmental variability on these patterns. First, working with UO Undergraduate Eric Zaneveld, we set up a simple model to capture the impact of a temperature gradient. We drew from metabolic theory, which shows a strong dependence of metabolic and demographic rates on temperature, and with Eric we demonstrated that metabolism can drive patterns in latitudinal diversity similar to those observed empirically, documented in his senior thesis.
More generally this approach takes an environmental parameter (temperature in this case) and uses information about organism function to predict patterns along a gradient. A parallel approach is to treat some or all environmental parameters implicitly, so that we look for average expectation values for patterns driven by environmental gradients. We think of this second framework as a neutral theory of environmental niches; neutral because we are averaging over many different effects, and as a first step treating species and their responses to environmental gradients neutrally; and niche because we are assuming that patterns are driven by environmental constraints rather than e.g. dispersal limitation, as in our previous work.

So far we have derived some new results (and rederived some existing results in a simpler form) for spatially-implicit models of community assembly. The processes we have built into these models include allopatric speciation, invasion, and environmental stochasticity---in contrast to existing neutral theories, which focus on point speciation, birth and deaths of individuals, and demographic stochasticity, without considering interactions between species or with the environment. We plot an example of the contrasting predictions for relative species abundances in the figure below.
We are currently developing a spatially-explicit version of these models, based on the dynamics of species ranges in space, and using this we will make niche-based predictions for spatially-explicit patterns like the taxa-area relationship and distance decay. The longer-term goal of this project is to combine dispersal and niche processes into a single framework, and to pick out explicit environmental parameters (like temperature, or salinity) when we need to make specific predictions about patterns along those gradients. We also plan to link our results with current empirical work by all three labs to map microbial taxon ranges from sequence data ("niche mapping"; see below), and aim to provide a mechanistic underpinning for iSEEM work in review on the impact of species range size and shape on spatial patterns.
Pollard Lab
PhylOTU
The identification of novel microbial species is great interest to microbial ecologists and evolutionary biologists. Collaborating with members of all three labs, Tom Sharpton led an effort to develop PhylOTU, a computational workflow that identifies Operational Taxonomic Units (OTUs, or a corollary for microbial species) directly from metagenomic data. As we have documented in previous progress reports, PhylOTU can identify OTUs from metagenomic data with relatively high affinity and can reveal the presence of microbial species that are missed by PCR-based investigations given various methodological biases. During this quarter, we wrote up our results and submitted them to PLoS Computational Biology. In late September, we received encouraging news from the editor, who invited us to resubmit after we revise our manuscript to accommodate minor changes suggested by the reviewers. We have made the PhylOTU source code publicly available here.
In addition, Tom Sharpton is working with another postdoc in the Pollard lab (Rebecca Lamb; not funded by the iSEEM grant) to streamline the PhylOTU software to accomodate very large metagenomic libraries. We have made substantial modifications to the software and radically improved its efficiency, most notable by enabling its deployment across multiple parallel nodes in a computer cluster. When we processed the GOS library (~10 million sequences) for our manuscript (pre-software revision), it took on the order of several days to identify OTUs. After our software improvements, PhylOTU now processes the same dataset in several hours. This updated version of PhylOTU is currently being leveraged by the Human Microbiome Project to identify novel microbial taxa living in and on the human body.
Simulations for Metagenomic Data
Samantha Riesenfeld made major improvements to the metagenomics simulations software pipeline described in previous progress reports. The most notable addition is that the pipeline now enables 16S data to be simulated, aligned, and processed in a parallel fashion to the way the AMPHORA protein families are used. The pipeline has also been revised to work with non-AMPHORA protein families. Together, these two changes vastly broaden the applications for the simulation pipeline, enabling studies of RNA gene markers and of protein-coding genes that are not part of the phylogenetic marker collection in AMPHORA. This latter feature enables additional marker genes to be added to the AMPHORA collection, as well as facilitating analyses involving functional genes of interest that may not be phylogenetically informative but which may be very relevant to studies of marine microbiology.
A short manuscript describing the features of the pipeline, including the capability to simulate different types of microbial communities and the streamlining of several aspects of metagenomic data generation and alignment, is in preparation. We expect to submit early in the next quarter. In the remaining part of the year, we will use the pipeline to complete a large-scale simulation study comparing the performance of different tools for phylogenetic tree building on metagenomic data sets.
Marine Microbial Range Maps
At a global scale, the spatial distributions of marine bacteria, viruses, and other microorganisms remain largely unknown. Learning the spatial distributions can aid the testing of biogeographical hypotheses, facilitate the identification of biodiversity hotspots, and allow prediction of responses to climate change. Given the role that marine microorganisms play in global biogeochemical cycles, addressing these questions is of great importance.
Mapping the global distributions of marine microbes is stymied by two factors. First, marine microbes have been sampled (via shotgun and PCR sequencing) at a relatively small number of locations. For instance, surface water samples have been collected and made publicly available from fewer than 500 locations. The second obstacle is incomplete sampling. For example, a species of alphaproteobateria may not occur in a Global Ocean Survey sample because it was absent at the sampling location, or because it was not observed despite being present (e.g., due to abundance, sampling depth, random factors).
Species distribution models (SDMs), which have been developed to map the distributions of macroorganisms, are well suited for overcoming both of these data limitations. SDMs utilize remote environmental data -- for instance, satellite observations of sea surface temperature and productivity -- to interpolate spatial distributions of taxa. The general idea behind SDMs is to infer the niche that a taxon occupies, based on the environmental conditions at the locations where it was seen. At a location where an observation was not collected, a prediction of occurrence is then based on the remote data: if the environmental conditions at that location are within the niche, the taxon is predicted to occur, while otherwise, it is predicted to be absent. Sophisticated SDMs have been developed in ecology which perform well with sparse data and incomplete sampling. These SDMs are appropriate for the data that are available for marine microbes.
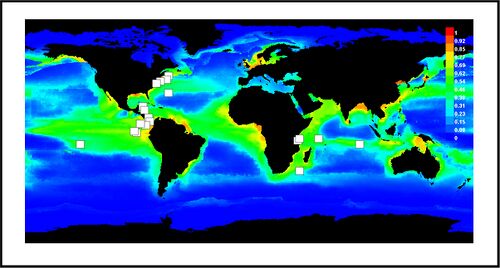
Josh Ladau led a team with members from all three labs to conduct a project aimed at mapping the global distributions of marine microbes. Our approach is to applying SDMs to interpolate the distributions of marine microorganisms from observed data. To apply SDMs, three components need to be assembled. First, observed occurrence data are necessary. The data that we have used are from three data sets: the GOS data, the MegX database, and the MICROBIS database. Each data set contains sequences from the 16S ribosomal RNA gene, which we used to make taxonomic classifications using the RDP classifier. Combining 16S data from all three sources, we compiled a database of the microbial taxa occurring at 246 marine locations across the globe. The second component of applying an SDM is remote data. Toward this end, we used measurements of annual mean sea surface temperature, primary productivity, sea ice cover, and salinity (Ready et al. 2010), all of which are at a global scale with a 0.5 degree of latitude/longitude resolution. The last component of an SDM is the model used to estimate the niche. Here we have used Maxent (Phillips et al. 2006), which is based on fitting a distribution of maximum entropy to observed occurrence data and remote environmental data. Maxent has been shown to perform well with sparse, presence-only data such as our database of microbial taxa. Using this approach, we mapped the distributions of numerous orders of marine microorganisms and made plots of the suitability of global environments for each order.
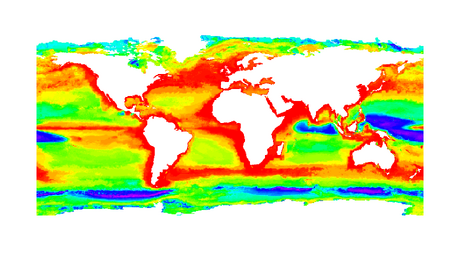
By overlaying the suitability maps for all orders, we derived detailed maps of global marine microorganism diversity. These maps indicate patterns similar to those found in marine macroorganims -- for instance, regions of low diversity in the eastern Pacific and southeastern Atlantic Oceans -- as well as surprising patterns, such as peaks in diversity in the temperate latitudes rather than in the tropics. Patterns of beta diversity are also intriguing, indicating a peak at very high latitudes, in contrast to a peak in the tropics which is commonly observed for macroorganisms.
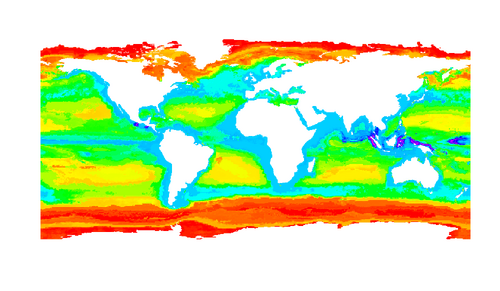
We have also begun investigating whether similar biogeographic "rules" hold in microbes and macroorganisms. For instance, we have investigated whether Rapoport's Rule (which states that the average size of species ranges is largest at high latitudes) holds for microorganisms. Our preliminary analyses suggest that it does. If this result holds, then it has important implications for how microbes respond to temporal environmental variability.
Wu Lab
Skin Microbiome Microdiversity Project
We have been investigating the diversity of bacteria living on the human skin, using the 16s rRNA sequences sampled in Grice et al, 2009. This data set contains ~112,000 16s sequences sampled from ten subjects at twenty-one different sites on the body. Our aims for this project are:
- To determine whether there are distinct skin habitat associations among OTUs clustered at identity thresholds above 97%. Since the 97% cut-off is commonly used to delineate microbial species, coherent sequence clusters with identity thresholds of 99% or greater with statistically significant habitat preferences might indicate ecotypes or other biologically relevant units of diversity below the species level. Preliminary results suggest that most OTUs even at the 99% cut-off are associated with either particular skin sites, particular sample subjects, or both.
- To determine whether associations of higher order taxa common to particular skin types shown previously by Grice et al. are universal among subgroups of those taxa. For example, the genus Corynebacteria is strongly associated with moist skin sites, while Propionibacteria are associated with sebaceous sites. Are these associations due to an adaptation to those conditions among all members of the genus, or are abundant individual OTUs or ecotypes within those taxa associated with particular skin sites? Preliminary results suggest that the most abundant OTUs of Corynebacteria seem to be associated with moist skin sites, in particular the inguinal crease and gluteal crease, though some abundant OTUs with putative associations to sebaceous sites have also been detected.
- To compare the groups generated by clustering based solely on sequence identity (OTUs) with ecotype predictions made using Ecotype Simulation (EcoSim). Specifically, we are interested in whether there is a particular sequence identity threshold for generating OTUs that most closely approximates ecotypes. These analyses are somewhat limited to the less abundant taxa due to the current limitations of the EcoSim software (<200 sequences). However, analyses of the Alpha-Proteobacteria sequences from this data-set suggest that the OTU identity threshold that most closely approximates the predictions of EcoSim varies depending on the taxon. OTUs were generated for each genus of Alpha-Proteobacteria at cutoffs ranging from 95% to 99.5%. We compared the number of OTUs predicted in each case to the number of ecotypes predicted by EcoSim. In most cases, a cutoff between 98% and 99% best approximated ecotypes, but in some genera the clusters generated by EcoSim were closest to those generated by the 99.5% cutoff.
C. Communications, Collaboration, Outreach and Education
Publications supported by this grant
- Sharpton, Riesenfeld, Kembel, Ladau, O'Dwyer, Green, Eisen, Pollard. “PhylOTU: A high-throughput procedure that identifies Operational Taxonomic Units from metagenomic data.” (In revision at PLoS Computational Biology)
- Ladau, Green, Pollard. “Beta Diversity Follows a Universal Model.” (In review at Theoretical Ecology)
- Kembel, Eisen, Pollard, Green. Community phylogenetics reveals novel insights into microbial diversity and community assembly. (In review at PLoS Biology)
Talks
- Kembel. "Ecophylogenetics: community ecology in the 'omics' era". Frontiers in Phylogenetics Symposium, Barcelona, Spain. October 2010.
- Kembel, Eisen, Pollard, Green. "Phylogenetic ecology and metagenomics". 18th Annual Meeting on Microbial Genomics, Lake Arrowhead, USA. September 2010.
- Ladau, Green, Pollard. "Inferring the shapes of species ranges from distance-decay relationships." Ecological Society of America 95th Annual Meeting, Pittsburgh, USA. August 2010
- Pollard. "Evolutionary Genomics in the Pollard Lab". UCSF seminar, San Francisco, CA. August 2010.
- Langille. “BioTorrents: A File Sharing Service For Scientific Data” Bioinformatics Technology Forum, Jun. 1, 2010, UC Davis, Davis, California, USA.
- Langille. “BioTorrents: A File Sharing Service For Scientific Data” Open Science Summit, Jul. 30, 2010, Berkeley, California, USA.
- Green. "Biodiversity theory in the metagenomics era". Marine Microbiology Initiative Symposium, GBMF.
Posters
- Darling, Eisen. "Estimating linkage among short metagenomic read fragments using Bayesian phylogenetics" 18th Microbial Genomics Meeting, Lake Arrowhead, CA Sept. 12-16, 2010.
- Ladau, Green, Pollard. "Inferring the spatial distributions of microbes from metagenomic data." 13th International Symposium on Microbial Ecology, Seattle, USA. August 22-27, 2010.
- Langille, Eisen. “Characterizing Protein Families of Unknown Function” 18th Annual International Meeting on Microbial Genomics, September 12-16, 2010, Lake Arrowhead, California, USA.
- Pollard, Ladau, Sharpton, Riesenfeld. "Using metagenomics to study uncultured microbes: Who is out there, where do they live, and what are they doing?" Statistical Genomics in Biomedical Research 5-Day Interdisciplinary Workshop. Banff International Research Station, Banff, Canada. July 18-23, 2010.
- Sharpton, Riesenfeld, Kembel, Ladau, O'Dwyer, Eisen, Green, and Pollard. “PhylOTU: A high-throughput procedure that identifies Operational Taxonomic Units from metagenomic data.” 13th Annual International Society for Microbial Ecology, Seattle, WA. August 22-27, 2010.
News
- The Theoretical Ecology Section of the ESA announced that the recipients of the 2010 Outstanding Theory Paper award are James O'Dwyer and Jessica Green, for their paper entitled "Field theory for biogeography: A spatially explicit model for predicting patterns of biodiversity" (Ecology Letters 13: 87-95).
- We have been asked by Dr. Eric Wommack to determine if our marker gene based approaches to the study of microbial metagenomic analysis can be extended to the viral community. We are currently exploring this option.
II. Group meetings
Weekly meetings
- Notes 7_2_10
- Notes 7_7_10
- Notes 7_14_10
- Notes 7_21_10
- Notes 7_28_10
- Notes 8_4_10
- Notes 8_11_10
- Notes 8_18_10
- Notes 8_25_10
- Notes 9_1_10
- Notes 9_8_10
- Notes 9_22_10
Other meetings
- July 12, 2010: Jessica and Katie met in San Francisco to discuss future directions for the iSEEM Team.
- July 16, 2010: Katie and Jonathan met with Kelly Kryc at Gladstone/UCSF.
- August 19-20, 2010: Josh and Steve met in Eugene to initiate the marine microbial range maps project (described above).
- August 24, 2010. Jessica, Josh and Tom met in Seattle at the International Society of Microbial Ecology to discuss the range map project
III. Any unexpected challenges that imperil successful completion of the Outcome
Nothing new to report here though we note, again, that the lack of progress is seeing CAMERA convert our tools into workflows for the community means that some of the work we report here will have less "reach" than it otherwise could have had. A possible solution to this would be to support a Software Engineer for some period of time to develop workflows ourselves and then these could be provided to CAMERA as well as to others.
