HRV:HRV
Home Lab Members Physiological Systems Monitoring Parameters in the ICU ECG HRV Clinician's Perspective Cardiorespiratory Monitors Signal Processing Deliverables Journal Abbreviations
HRV
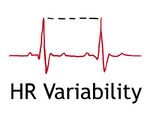
HRV is the beat-by-beat variation in heart rate. The autonomic nervous system (ANS) controls HRV via the sympathetic and parasympathetic nervous system, which increase and decrease the heart rate respectively[1]. A high HRV means that the body responds to inputs from both systems and can adapt easily to stimuli[2].
![Typical HRV[2]](https://oww-files-thumb.sfo3.cdn.digitaloceanspaces.com/f/f9/HRV.png/400px-HRV.png)
![Relationship between HRV and age(Deusen,Mark van)[2]](https://oww-files-public.sfo3.cdn.digitaloceanspaces.com/9/90/HRVandAge.png)
HRV is a critical marker with vast existing applications, and countless potential applications, some of which are very relevant in the current COVID-19 pandemic. Investigating HRV is hence not only important, but crucial. Our dual-phase project will initially focus on exploring the physiological basis behind HRV and which systems influence it.
Relationship to ANS
During chronic stress - both psychological and physical – the parasympathetic nervous system (PNS) is inhibited, and the sympathetic nervous system (SNS) goes into overdrive. This imbalance between the two branches of the autonomic nervous system (ANS) can therefore be a good indicator of stress, and vulnerability to stress [3], and can be measured using heart rate variability (HRV).
HRV is highly influenced by the ANS and is said to be the result of the interaction of the ANS and the sinoatrial node (SAN) [4]. Fluctuations in the ANS due to shifts in the balance between the sympathetic nervous system (SNS) and the parasympathetic nervous system (PNS) are reflected in the spectral analysis and time series analysis of HRV [5]. In a healthy heart, the PNS is predominantly active at rest, whilst the SNS takes over with activity, speeding up heart rate as and when is needed.
ANS function is invaluable in the prognosis of various conditions, including depression, heart failure (HF) and peripheral vascular disease (PVD) [6]. Increased sympathetic outflow has been linked to worse prognosis of conditions such as renal damage and heart failure [7], and these comorbidities increase your risk of mortality with COVID-19 [8]. By inference, HRV could be a useful indicator of prognosis in COVID-19 patients with these comorbidities.
As the ANS is a branch of the peripheral nervous system, it can therefore be argued that disturbances in the ANS reflect the condition of the peripheral nervous system. Neurological symptoms affect about 36% of COVID-19 patients [9], and can manifest in both the central nervous system (CNS) or the peripheral nervous system. In theory, HRV could therefore also indicate the degree to which the peripheral nervous system has been affected in COVID-19 patients.
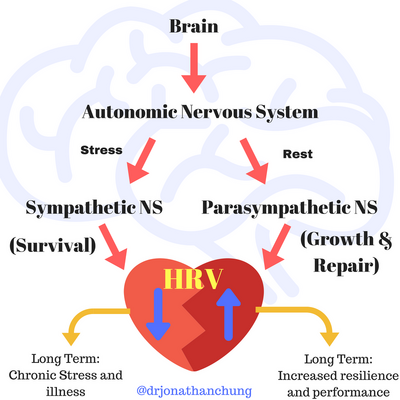
Figure 5.1a: Relationship of ANS to HRV [10]
Measuring HRV
Standards
The sampling rate of an ECG signal is oftentimes not mentioned in HRV analysis, which is one of the shortcomings of current HRV processing techniques. A standardized checklist has been devised to ensure HRV is being assessed and used properly [11], a snapshot of which is found below.
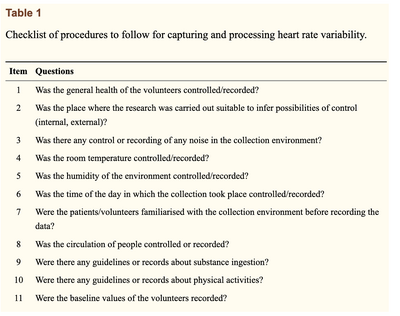
HRV is heavily influenced by numerous factors, and as such, reliably recording and linking this parameter to physiological changes in the cardiorespiratory system can prove difficult for clinicians. Even the smallest of changes, such as active or passive postural changes [13], can influence cardiovascular control of HRV. Hence, recording all these influential factors, although vital and doable, can prove a strenuous process.
Knowing this, one must hence question the practicality of this parameter in the clinical setting, as well as the feasibility of using it in day-to-day clinical decision-making. If the checklist for accuracy in measurement is so exhaustive, is it realistic to expect clinicians to use this parameter regularly? One must therefore consider the significance of the practicality aspect of this project – for us to devise a successful signal processing method is imperative, but perhaps, equally as important would be to ensure our method allowed a simpler, more time-efficient approach to allow use in real-time.
Domains
Time Domain
HRV is considered a non-invasive marker of the activity of the vagal and sympathetic function [14]. The gold standard for measuring HRV is contact ECG, which is then analysed in several domains, one of which is time-domain, where two indices are recognised:
1. Short-term variability (STV): also called “beat-to-beat variation”, represents fast changes in heart rate (HR);
2. Long-term variability (LTV): represents slower fluctuations. [15]
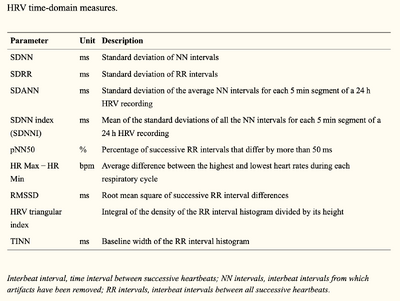
The time-domain indices above reflect the beat-to-beat changes in a certain timeframe, and are usually calculated by calculating the mean and standard deviation (SDNN) of the RR intervals from an ECG. Common time domain measures are illustrated in the table below.
Frequency Domain
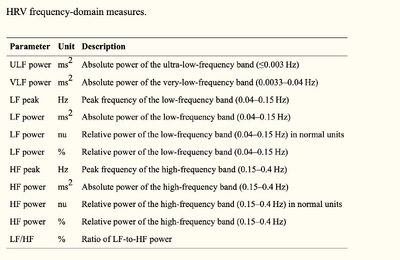
However, to count the number of high and low frequency beats that occur, a frequency-domain is used. [16] Frequency-domain measurements are usually classified into four frequency bands based on absolute power:
i) Ultra-Low-Frequency (≤0.003 Hz)
ii) Very-Low-Frequency, VLF (0.0033–0.04 Hz)
iii) Low-Frequency, LF (0.04–0.15 Hz)
iv) High-Frequency, HF (0.15-0.4 Hz)
Some HRV Frequency-Domain parameters are illustrated in the table below. These are in accordance with and were published by the Task Force of the European Society of Cardiology and the North American Society of Pacing and Electrophysiology (1996).
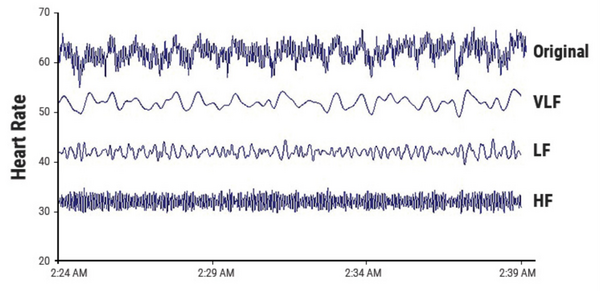
Power spectral analysis can be used to separate a complex HRV waveform into its component rhythms which are VLF, LF, and HF. Both frequency and amplitude information can be obtained from the spectral analysis showing that analysis in the frequency domain can be more advantageous compared to the time domain. [17]
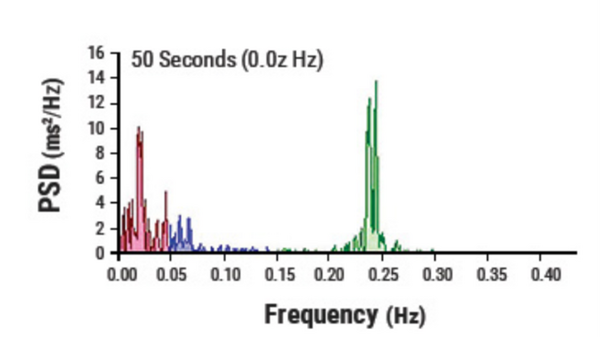
Spectral HRV analysis shows how the power of an HRV recording is distributed as a function of frequency which consequently allows for the assessment of autonomic modulation of critically ill patients. Figure 5.2.2c shows the area under the spectral peaks for each frequency band, VFLP, LFP, HFP, and TP (Total Power). [18]
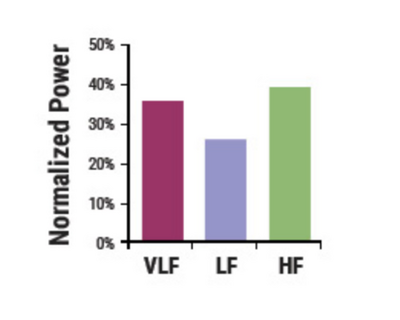
The normalized power of each frequency band can provide clinicians with valuable information. Normalized VLFP is the index of renin-angiotensin-aldosterone modulation, thermal regulation, and vagal withdrawal. Normalized LFP is the index of combined sympathetic and vagal activities while the normalized HFP and HFP act as the index of cardiac vagal activity.[18]
Non-linear Domains
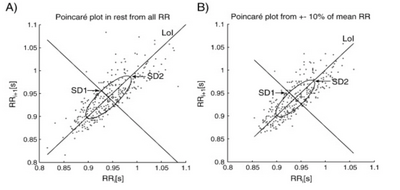
Finally, considering the complexity of HRV, non-linear methods are also used to analyse HRV, the most commonly used being the Poincaré plot, an example of which is illustrated in the figure below. The Poincaré plot is essentially a scatter graph which allows the visualisation of physiological fluctuations in HR.
Clinical Significance
HRV has traditionally been applied predominantly with reference to the cardiovascular system [20], but through this project we are hoping to equally focus on the respiratory system. If accurate signal processing methods are further developed through this project, this would improve the utility and add facility to continuous cardiorespiratory monitoring in ICU settings, for example. Research has already suggested the possibility of monitoring COVID-19 using wearable devices that measure HRV [21]. Therefore, HRV monitoring could be very relevant to the current pandemic.
Current Applications
Since the use and analysis of HRV has become more and more prevalent, the conditions for which HRV can be used as a reliable marker have rapidly expanded. The list includes, but is not limited to:
- Diabetic Neuropathy - patients with diabetic autonomic neuropathy have been shown to have reduced or absent beat-to-beat variation. [22] Measurement and assessment of HRV therefore allows screening of patients with diabetic neuropathy for cardiac involvement [22].
Cadiovascular Risk Stratification
- Chagas Disease - This is one of the main causes of sudden cardiac death in Latin America. Even in the absence of heart failure, in patients with Chagas disease, there are abnormalities in the neural control of HRV [23]. Short-term HRV index values were consistently reduced in the Chagas' disease groups. [24]
- Left Ventricular Hypertrophy (LVH) - patients with LVH have been shown to have a significantly reduced HRV [25], with an inverse relationship between HRV and left ventricle (LV) mass.
- Myocardial Infarction (MI) - HRV is reduced after a myocardial infarction as a neural response to the infarction. Monitoring HRV is useful in predicting the prognosis of patients who have suffered an MI [26], as patients with lower HRV were more susceptible to decreased baroreceptor sensitivity (BRS), which diminished autonomic control [27], amongst other reasons.
- Congestive Heart Failure (CHF) - HRV is significantly depressed in patients with CHF [28], and has independent prognostic values in these patients.
- Malignant Arrhythmias - a non-linear measure of HRV obtained from short-term ECG recordings has important prognostic value in patients with arrhythmias, and has the potential of predicting the risk of death in patients who have implantable cardioverter-defibrillators (ICD) [29]
- Essential Hypertension -
Potential Applications
- Sports Physiology - HRV has been proven to provide parameters that are relevant in analysing the stress the body is under during physical activity and training, and could provide insight into recovery post-training. [30] More research is needed to check exactly how HRV is affected by exercise and what that means for the body during the recovery phase.
- Trauma - HRV is generally decreased in trauma patients, and therefore there is potential for it to be used as a monitoring tool to predict mortality and morbidity in trauma patients [31]
- Organisational Neuroscience - recent research shows that HRV has potential in applications to the studies of emotions, stress and burnout, and behabioural changes, amongst others [32].
References
- ↑ M. Campos, “Heart rate variability: A new way to track well-being.” https://www.health.harvard.edu/blog/heart-rate-variability-new-way-track-well-2017112212789 (accessed Nov. 14, 2020).
- ↑ 2.0 2.1 2.2 2.3 M. van Deusen, “Everything You Need to Know About Heart Rate Variability (HRV),” 2019. https://www.whoop.com/thelocker/heart-rate-variability-hrv/ (accessed Nov. 14, 2020).
- ↑ S. W. Porges, “Cardiac vagal tone: A physiological index of stress,” Neurosci. Biobehav. Rev., vol. 19, no. 2, pp. 225–233, Jun. 1995, doi: 10.1016/0149-7634(94)00066-A.
- ↑ Y. Yaniv et al., “Deterioration of autonomic neuronal receptor signaling and mechanisms intrinsic to heart pacemaker cells contribute to age‐associated alterations in heart rate variability in vivo,” Aging Cell, vol. 15, no. 4, pp. 716–724, Aug. 2016, doi: 10.1111/acel.12483.
- ↑ A. Albarado-Ibañez, J. E. Avelino-Cruz, M. Velasco, J. Torres-Jácome, and M. Hiriart, “Metabolic Syndrome Remodels Electrical Activity of the Sinoatrial Node and Produces Arrhythmias in Rats,” PLoS One, vol. 8, no. 11, p. e76534, Nov. 2013, doi: 10.1371/journal.pone.0076534.
- ↑ B. M. Curtis and J. H. O’Keefe, “Autonomic Tone as a Cardiovascular Risk Factor: The Dangers of Chronic Fight or Flight,” Mayo Clin. Proc., vol. 77, no. 1, pp. 45–54, Jan. 2002, doi: 10.4065/77.1.45.
- ↑ A. C. P. Barretto et al., “Increased muscle sympathetic nerve activity predicts mortality in heart failure patients,” Int. J. Cardiol., vol. 135, no. 3, pp. 302–307, Jul. 2009, doi: 10.1016/j.ijcard.2008.03.056.
- ↑ A. Porzionato et al., “Sympathetic activation: a potential link between comorbidities and COVID‐19,” FEBS J., vol. 287, no. 17, pp. 3681–3688, Sep. 2020, doi: 10.1111/febs.15481.
- ↑ L. Mao et al., “Neurological Manifestations of Hospitalized Patients with COVID-19 in Wuhan, China: A Retrospective Case Series Study,” SSRN Electron. J., 2020, doi: 10.2139/ssrn.3544840.
- ↑ Online. Available from: https://www.kyleglickman.com/the-best-vital-sign-youre-not-looking-at-hrv-heart-rate-variability/ (accessed 14 December 2020)
- ↑ A. M. Catai, C. M. Pastre, M. F. de Godoy, E. da Silva, A. C. de M. Takahashi, and L. C. M. Vanderlei, “Heart rate variability: are you using it properly? Standardisation checklist of procedures,” Brazilian J. Phys. Ther., vol. 24, no. 2, pp. 91–102, Mar. 2020, doi: 10.1016/j.bjpt.2019.02.006.
- ↑ A. M. Catai, C. M. Pastre, M. F. de Godoy, E. da Silva, A. C. de M. Takahashi, and L. C. M. Vanderlei, “Heart rate variability: are you using it properly? Standardisation checklist of procedures,” Brazilian J. Phys. Ther., vol. 24, no. 2, pp. 91–102, Mar. 2020, doi: 10.1016/j.bjpt.2019.02.006.
- ↑ A. Catai et al., “Effect of the Postural Challenge on the Dependence of the Cardiovascular Control Complexity on Age,” Entropy, vol. 16, no. 12, pp. 6686–6704, Dec. 2014, doi: 10.3390/e16126686.
- ↑ K. C. BILCHICK and R. D. BERGER, “Heart Rate Variability,” J. Cardiovasc. Electrophysiol., vol. 17, no. 6, pp. 691–694, Jun. 2006, doi: 10.1111/j.1540-8167.2006.00501.x.
- ↑ U. R. Acharya, K. P. Joseph, N. Kannathal, C. M. Lim, and J. S. Suri, “Heart rate variability: A review,” Med. Biol. Eng. Comput., vol. 44, no. 12, pp. 1031–1051, 2006, doi: 10.1007/s11517-006-0119-0.
- ↑ 16.0 16.1 16.2 F. Shaffer and J. P. Ginsberg, “An Overview of Heart Rate Variability Metrics and Norms,” Front. Public Heal., vol. 5, no. September, pp. 1–17, 2017, doi: 10.3389/f
- ↑ 17.0 17.1 17.2 17.3 “Chapter 03: Heart Rate Variability | HeartMath Institute.” https://www.heartmath.org/research/science-of-the-heart/heart-rate-variability/ (accessed Jan. 04, 2021).
- ↑ 18.0 18.1 I. C. Chen et al., “High-frequency power of heart rate variability can predict the outcome of thoracic surgical patients with acute respiratory distress syndrome on admission to the intensive care unit: A prospective, single-centric, case-controlled study,” BMC Anesthesiol., vol. 18, no. 1, p. 34, Apr. 2018, doi: 10.1186/s12871-018-0497-5.
- ↑ [1] A. Kubičková, J. Kozumplík, Z. Nováková, M. Plachý, P. Jurák, and J. Lipoldová, “Heart rate variability analysed by Poincaré plot in patients with metabolic syndrome,” J. Electrocardiol., vol. 49, no. 1, pp. 23–28, Jan. 2016, doi: 10.1016/j.jelectrocard.2015.11.004.
- ↑ J. F. Thayer, S. S. Yamamoto, and J. F. Brosschot, “The relationship of autonomic imbalance, heart rate variability and cardiovascular disease risk factors,” International Journal of Cardiology, vol. 141, no. 2. Int J Cardiol, pp. 122–131, May 28, 2010, doi: 10.1016/j.ijcard.2009.09.543.
- ↑ J. M.S., L. L., R. R. Nair, V. P., G. R., and R. Jothikumar, “Monitoring and sensing COVID-19 symptoms as a precaution using electronic wearable devices,” Int. J. Pervasive Comput. Commun., vol. 16, no. 4, pp. 341–350, Jul. 2020, doi: 10.1108/IJPCC-06-2020-0067.
- ↑ 22.0 22.1 T. Wheeler and P. J. Watkins, “Cardiac Denervation in Diabetes,” BMJ, vol. 4, no. 5892, pp. 584–586, Dec. 1973, doi: 10.1136/bmj.4.5892.584.
- ↑ A. L. P. Ribeiro et al., “Power-law behavior of heart rate variability in Chagas’ disease,” Am. J. Cardiol., 2002, doi: 10.1016/S0002-9149(01)02263-9.
- ↑ S. Guzzetti, D. Iosa, M. Pecis, L. Bonura, M. Prosdocimi, and A. Malliani, “Impaired heart rate variability in patients with chronic Chagas’ disease,” Am. Heart J., vol. 121, no. 6, pp. 1727–1734, Jun. 1991, doi: 10.1016/0002-8703(91)90019-E.
- ↑ M. K. Mandawat et al., “Heart rate variability in left ventricular Hypertrophy,” Heart, 1995, doi: 10.1136/hrt.73.2.139.
- ↑ M. M. Wolf, G. A. Varigos, and J. G. Sloman, “Sinus arrhythmia in acute myocardial infarction,” Med. J. Aust., 1978, doi: 10.5694/j.1326-5377.1978.tb131339.x.
- ↑ M. T. La Rovere, J. T. Bigger, F. I. Marcus, A. Mortara, and P. J. Schwartz, “Baroreflex sensitivity and heart-rate variability in prediction of total cardiac mortality after myocardial infarction,” Lancet, vol. 351, no. 9101, pp. 478–484, Feb. 1998, doi: 10.1016/S0140-6736(97)11144-8.
- ↑ S. Boveda et al., “Prognostic value of heart rate variability in time domain analysis in congestive heart failure,” J. Interv. Card. Electrophysiol., 2001, doi: 10.1023/A:1011485609838.
- ↑ J. S. Perkiömäki, W. Zareba, J. P. Daubert, J.-P. Couderc, A. Corsello, and K. Kremer, “Fractal correlation properties of heart rate dynamics and adverse events in patients with implantable cardioverter-defibrillators,” Am. J. Cardiol., vol. 88, no. 1, pp. 17–22, Jul. 2001, doi: 10.1016/S0002-9149(01)01578-8.
- ↑ M. Amano, T. Kanda, H. Ue, and T. Moritani, “Exercise training and autonomic nervous system activity in obese individuals,” Med. Sci. Sports Exerc., 2001, doi: 10.1097/00005768-200108000-00007.
- ↑ M. L. Ryan, C. M. Thorson, C. A. Otero, T. Vu, and K. G. Proctor, “Clinical Applications of Heart Rate Variability in the Triage and Assessment of Traumatically Injured Patients,” Anesthesiol. Res. Pract., vol. 2011, no. 8, pp. 1–8, Aug. 2011, doi: 10.1155/2011/416590.
- ↑ S. Massaro and L. Pecchia, “Heart Rate Variability (HRV) Analysis: A Methodology for Organizational Neuroscience,” Organ. Res. Methods, vol. 22, no. 1, pp. 354–393, Jan. 2019, doi: 10.1177/1094428116681072.
