HRV:ECG
Home Lab Members Physiological Systems Monitoring Parameters in the ICU ECG HRV Clinician's Perspective Cardiorespiratory Monitors Signal Processing Deliverables Journal Abbreviations
ECG
Overview
An ECG is a recording of the electrical signals produced by the heart[1]. There are several different types of ECG monitors, their differences mainly being how many leads they operate with, and how long they monitor an individual for. Fig 1a shows a typical ECG, where atrial depolarisation, ventricular depolarisation and ventricular repolarisation are represented by the P wave, QRS complex and T wave respectively[2]. Variations in ECG readings can be used to detect arrhythmias, coronary heart disease, heart attacks and cardiomyopathy[3], although this proves to be challenging. A study conducted by the Heart Rhythm Society (HRS) found that less than 1/4 of 800 physicians distinguished the length of all QT intervals correctly[4].
![A typical ECG recording (Friederich,Patrick)[5]](https://oww-files-thumb.sfo3.cdn.digitaloceanspaces.com/8/8e/HRV_ECG_recording.png/400px-HRV_ECG_recording.png)
![Abnormal ECG recordings and corresponding disease type [2]](https://oww-files-public.sfo3.cdn.digitaloceanspaces.com/2/21/HRV_ECG_disease.png)
Electrical Activity of the Heart
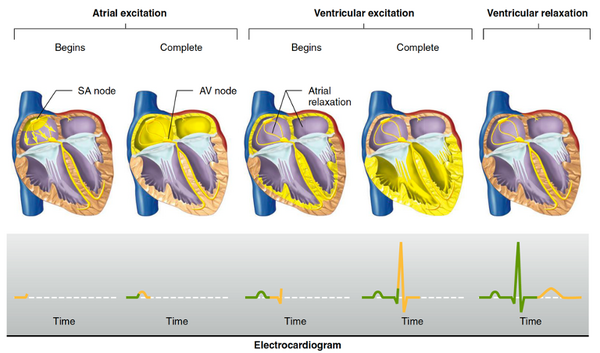
The first discovery of electrical activity in the heart was made in 1856 by Rudolf Albert von Kolliker and Heinrich Muller[2]. The heart is an involuntary muscle, meaning that cardiac muscle cells contract according to the action potentials (APs) generated by the pacemaker cells. In a normal person, the sinoatrial (SA) node, located in the right atrium, initially depolarises and APs spread throughout the atria via gap junctions between cells, causing them to contract first[6]. The action potentials are then conducted through internodal pathways to the atrioventricular (AV) node, and finally to the bottom of the ventricles through the bundle of His[6]. The relatively slow conduction of the APs to the ventricles ensures that there is a delay between the contraction of the atria and the ventricles and that the ventricles contract from bottom upwards to ensure maximum ejection[2].
Parts and Features of the ECG
ECG Waves
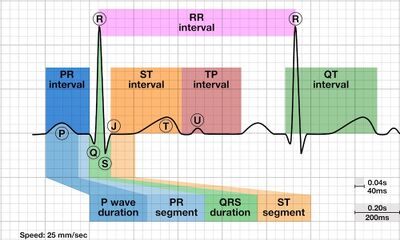
Atrial depolarisation, ventricular depolarisation and ventricular repolarisation can be seen on the ECG (Fig 3a), corresponding to the appearance of a P wave, QRS complex and T wave respectively[2]. Atrial repolarisation cannot be seen on the ECG as the current is too small. The length of the PR interval is the time taken for APs to reach the ventricles from the atria, in other words the AV node delay, and the ST segment represents the uniform depolarisation and rapid ejection of the ventricles, which corresponds to the plateau of the ventricular APs[2]. The QT interval measures the duration of depolarisation and repolarisation of the ventricles [6]. Normalising the QT interval with HR gives the corrected QT (QTc), where the formula is: QTc=(measured QT)/√(RR interval)[7]
ECG Intervals
Table 1 shows the range of interval values in a healthy patient, which are affected by age and gender. A study by Uygur et al. shows how the ECG changes in children with age, where there is a decrease in HR, but an increase in P duration, PR interval and QRS duration[9]. There is also an increase in PR and QT intervals with age in adults, however, there is a decrease in QRS duration[10]. Although data from Rijnbeek shows that there is consistently longer QRS duration for boys, Dickinson suggests that this is not significant[11]. In adults, however, Rijnbeek et al. shows that ST segment and Q wave duration are longer in men compared to women[12].
| Age Group | PR Interval/s | QRS Complex/s | corrected QT (QTc) Interval/s |
|---|---|---|---|
| Adult[13] | 0.12-0.22 | <0.12 | <0.45 (males), <0.47 (females) |
| Children[14] | 0.11-0.21 | 0.05-0.07 | <0.49 (infants), <0.44 |
Other ECG Features
Wave amplitude and axis are also commonly analysed features of ECGs. Bachman et al. provides evidence that the R, S and T wave amplitudes decrease with age and a leftward shift of the frontal plane axis[10]. R, S and T wave amplitudes also differ with gender[12].
ECG Lead Placement
The first ECG was recorded in 1887 by Augustus Waller and was improved by Willem Einthoven, for which he won a Nobel prize in 1924[15]. Basic ECGs are recorded using 3 leads (see Fig 4a) attached to the wrists and ankles for minimal interference from the contracting muscles[2]. Current cardiographs (see Fig 2) and most cardiorespiratory monitors incorporate 12 leads. The augmented limb, or Goldberger's, leads are positioned 30° between leads I, II and III and improve ischaemia/infarction detection[16]. The placement of leads (see Table 2) can significantly change the recorded ECGs, thus inaccuracy in lead placement could cause misdiagnosis of patients[17].
![Leads I, II and III are placed at 60° to each other, forming Einthoven's triangle [19]](https://oww-files-thumb.sfo3.cdn.digitaloceanspaces.com/2/28/EinthovenTri.jpg/400px-EinthovenTri.jpg)
![Placement of leads V1-V6 [20]](https://oww-files-thumb.sfo3.cdn.digitaloceanspaces.com/1/18/EcgLeadPlacement.jpg/400px-EcgLeadPlacement.jpg)
![Placement of leads table [20]](https://oww-files-thumb.sfo3.cdn.digitaloceanspaces.com/9/9d/LeadPlacement.png/600px-LeadPlacement.png)
ECG leads will record different waveforms[20] (Fig 4c) as they are sensitive to different electrical activites of the heart. For example, the largest deflection for the P wave is seen in lead II[21], whereas the Q wave is normally observed from leads I, aVL, V5 and V6[22]. Thus, ECG lead placement is important in obtaining correct ECG waveforms for the diagnosis of patients. The position and polarity of the electrodes on the chest will affect the ECG readings obtained[23]. Despite this, mistakes due to incorrect lead placement or lead reversal are still prevalent among clinicians, which could do more harm than good[24][25]. Incorrect cable connections occur in up to 4% of 12-lead ECG recordings, with the greatest proportion found in the ICU[26].
![ECG leads record different waveforms (A and B show separate times of recording) [47]](https://oww-files-thumb.sfo3.cdn.digitaloceanspaces.com/8/8a/EcgdiffLeads.png/400px-EcgdiffLeads.png)
Clinical Importance of ECG
ECGs are used in hospitals for the following reasons [28]:
- Looking for the cause of chest pain
- Identifying irregular heartbeats
- Determining overall health of heart before procedures, for example surgery
- Tracking heart health after treatment for conditions such as myocardial infarction or endocarditis
- Used to obtain a baseline of regular heart function to compare with future examinations
Variations in frequency, amplitude and shape are examined to diagnose issues. It is important to note that age, sex and race can also affect the morphology of an ECG [29].
Morphologies
The main function of ECGs is to aid clinicians in identifying cardiorespiratory-related risks and diseases in patients. Abnormal waveforms in an ECG recording are related to conditions affecting the electrical pathways of the heart.
Some examples of changes in the morphology which can indicate a possible medical condition include[30]:
- Changes in the shape of P wave – mitral or pulmonary stenosis, this is where the mitral or pulmonary valves become narrower meaning less blood is pumped through the heart.
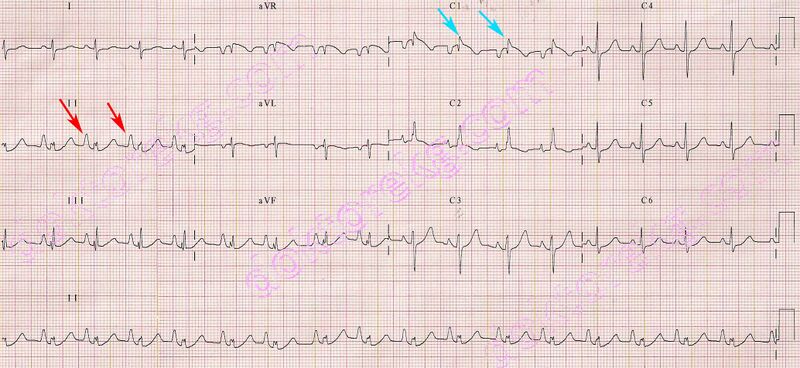
- Changes in the interval between P and R waves- first degree block atrioventricular block, this is where conduction through the atrioventricular node is delayed, so there is a delay in the contraction of the ventricles.
- Loss of R wave amplitude- myocardial infarction, which is a heart attack, this occurs when blood through to the heart in greatly reduced causing damage to heart muscle.

- Increased frequency of the entire PQRST segment- tachycardia, the heart is beating to fast generally classified with a resting rate is above 100bpm.
Cardiac-related Diseases
Cardiac events are the main cause of death for postoperative patients and thus monitoring cardiac health of the patient through ECGs is very important[33]. The presence of major and minor ECG abnormalities in the elderly typically indicate a greater risk of coronary heart disease (CHD)[34].
PR Interval
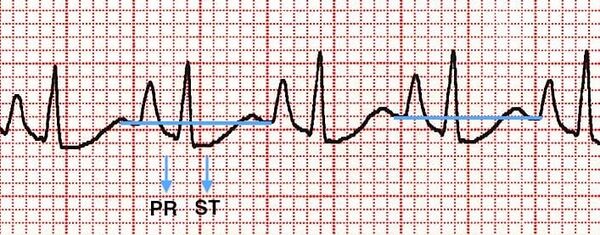
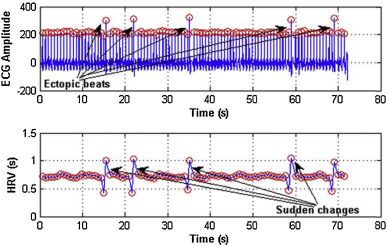
The PR interval represents the AV node delay. As such, prolongation of the PR interval implies a defect in the conduction of APs from the atria to the ventricles, which can result in varying degrees of heart block[2]. One of the most common cardiac conditions is arrhythmia, which is an irregular heart rhythm. Ectopic beats are spontaneously generated by ventricular cells and can be observed from an early broad QRS complex which is not preceded by a P wave[2].

Atrial arrhythmia
Tachycardia is a condition where the HR is above 100bpm[36]. Atrial tachycardia results from the atria contracting ineffectively and having insufficient time for relaxation and blood filling, thus affecting P waves[2]. AV nodal re-entry tachycardia is the most common form of tachycardia and is seen from narrow QRS complexes[2].

Similarly, atrial flutter is caused by the passing of the excitations in RA in an anticlockwise direction, rather than to the LA and AV node[2]. Atrial flutter is characterised by an ECG with a saw-tooth pattern (Fig 6.2.2b)[2].

Atrial fibrillation is a form of arrhythmia and is the most common heart rhythm disturbance[39]. ECGs show small, irregular f waves instead of P waves which result from the occasional transmission of APs to the ventricles as the excitation spreads throughout the atria.
Ventricular arrhythmia
Ventricular tachycardia may arise from ischaemia and cardiomyopathy. P waves appear infrequently on the ECG[2]. Ventricular fibrillation (Fig 6.2.3) is the most dangerous cardiac arrhythmia, as the uncoordinated excitations in the ventricle result in no cardiac output and death within minutes. The ECG is irregular and random[2].

ST Segment and ischaemia
Respiratory-related Diseases
Chronic Obstructive Pulmonary Disease (COPD)
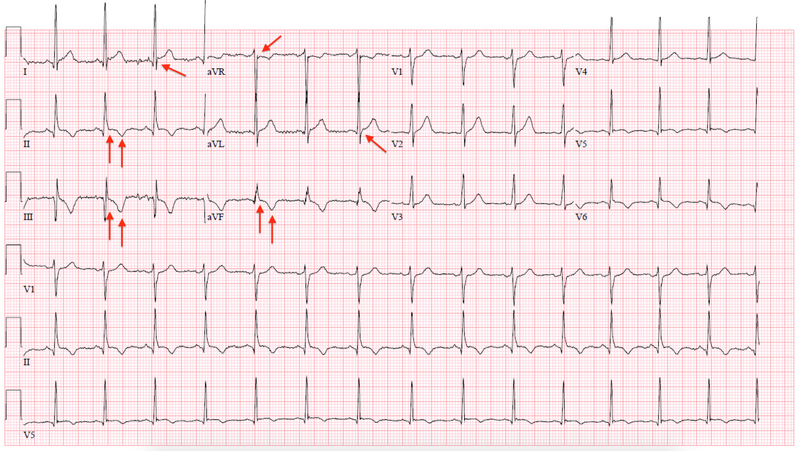
As the cardiovascular and respiratory systems are work together closely, respiratory diseases are also monitored using ECGs to warn doctors of complications. For COPD patients, the destruction of lung tissue eventually leads to the failure of the right side of the heart[41]. ECG monitoring is important as cardiac failure is the main cause of death for COPD[41]. The RR interval, from which HR can be calculated, is one of the main parameters monitored for COPD exacerbations[41]. Other common ECG changes are similar to those seen in arrhythmia, as well as Q wave abnormality and late R wave progression[41].
Covid-19
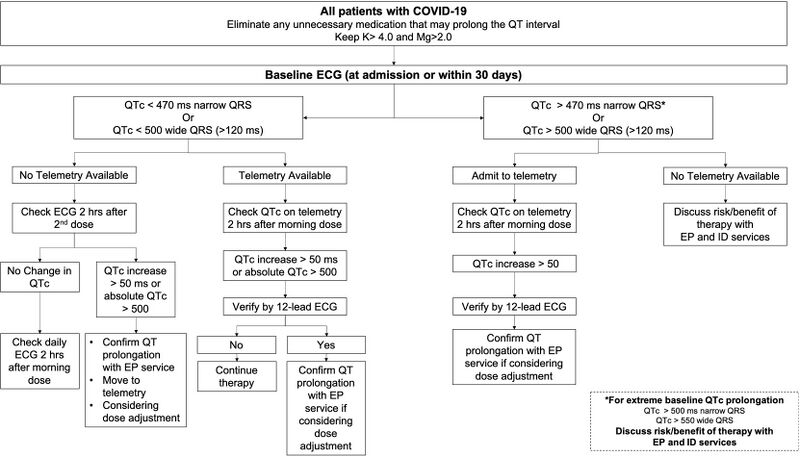
Covid-19 is another respiratory disease with various CVD implications[43][44][45]. Covid-19 infects the body through angiotensin-converting enzyme 2 (ACE2), which is found mostly in the lungs and moderately in the heart[45]. The severity and morbidity of Covid-19 is higher for patients with existing CV diseases[43]. As drugs used to treat Covid-19 may prolong the QT interval, ECG monitoring can warn doctors of complications such as ventricular arrhythmias and Torsades des Pointes and stop the prescription of hydroxychloroquine (HCQ), azithromycin and antivirals[45][46]. The American Heart Association has released a guideline for ECG monitoring of patients treated with these drugs, while local hospitals have defined recommended clinical pathways for discontinuation of drug therapy as in Fig 6.3.2b[46]. In addition, there is a positive correlation between QT prolongation and ICU admission and intubation[46].
Relationship with HRV
This section gives a brief discussion of how ECGs and HRV are related. For more in-depth information on HRV, please visit the HRV tab.
RR Interval
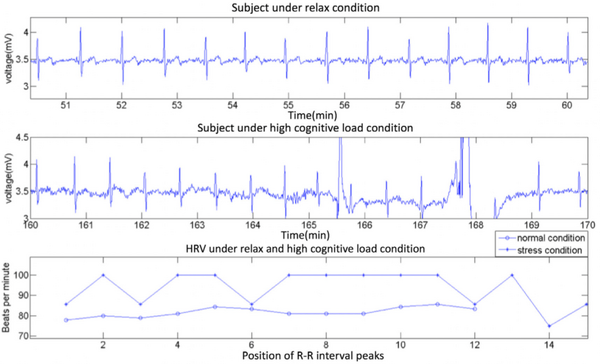
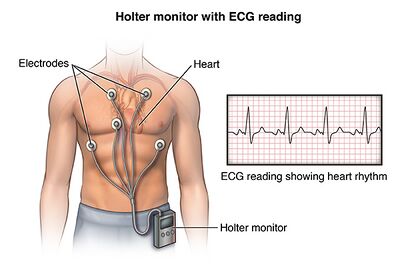
The RR interval is the duration between two consecutive R peaks of the QRS complex[48]. The normal range for RR intervals is 0.6-1.2s when a person is at rest[49] but will increase or decrease according to activity level. This variation in RR interval length is known as HRV (Figure 2), which is affected by both age and gender[50]. HRV can be interpreted from longer ECG signals observed on 24h Holter monitors (Figure 7.1b)[51] or cardiorespiratory monitors in the hospital.
HRV Interpretation
Changes in HRV are caused by the autonomic nervous system (ANS) as the sympathetic and parasympathetic nervous systems are responsible for increasing and decreasing HR respectively[54]. Good health is associated with high HRV over a long timescale as it shows that the body can adapt to different situations[55]. However, high HRV on a short timescale can indicate conditions like atrial fibrillation[56], especially if there are no changes to activity or external stimuli. Interestingly, conditions such as COPD[57] and cardiomyopathy[58] are found to decrease HRV.
HRV Analysis
HRV can be analysed in the time and frequency domains, using different methods of signal processing and statistics[56][59][60][61]. The main challenge in HRV calculation is the accurate detection of R peaks, which can be obstructed by noise or irregularities due to existing conditions[61]. The automatic classification of cardiac conditions using ECG/HRV features may also be possible with machine learning, using large ECG datasets from healthy and sick individuals for training[62][63].
References
- ↑ NHS, “Electrocardiogram.” https://www.nhs.uk/conditions/electrocardiogram/ (accessed Nov. 14, 2020).
- ↑ 2.00 2.01 2.02 2.03 2.04 2.05 2.06 2.07 2.08 2.09 2.10 2.11 2.12 2.13 2.14 2.15 N. Herring and D. J. Paterson, Levick’s Introduction to Cardiovascular Physiology, 6th ed., vol. 1. Milton, 2018.
- ↑ J.-L. Vincent, “Understanding cardiac output,” Crit. Care, vol. 12, no. 4, p. 174, 2008, doi: 10.1186/cc6975.
- ↑ I. Rowlandson, “How to Detect Long QT in a Heartbeat.” https://clinicalview.gehealthcare.com/article/how-detect-long-qt-heartbeat (accessed Nov. 14, 2020).
- ↑ P. Friederich, “Monitoring of the QT Interval in Perioperative and Critical Care,” 2020. https://clinicalview.gehealthcare.com/white-paper/monitoring-qt-interval-perioperative-and-critical-care (accessed Nov. 14, 2020).
- ↑ 6.0 6.1 6.2 6.3 E. P. Widmaier author, Vander’s human physiology : the mechanisms of body function, Fifteenth. 2019.
- ↑ I. Birnbaum, Y. Birnbaum, and G. N. Levine, “Electrocardiography,” in Cardiology Secrets, Elsevier, 2017, pp. 21–28.
- ↑ “U Wave • LITFL Medical Blog • ECG Library Basics.” https://litfl.com/u-wave-ecg-library/ (accessed Jan. 20, 2021).
- ↑ Ö. Uygur and A. Aydoğdu, “Normal electrocardiogram values of healthy children,” Turkish Arch. Pediatr. Pediatr. Arşivi, vol. 54, no. 2, p. 93, 2019, doi: 10.14744/TURKPEDIATRIARS.2019.04568.
- ↑ 10.0 10.1 S. Bachman, D. Sparrow, and L. K. Smith, “Effect of aging on the electrocardiogram,” Am. J. Cardiol., 1981, doi: 10.1016/0002-9149(81)90081-3.
- ↑ D. F. Dickinson, “The normal ECG in childhood and adolescence,” Heart, vol. 91, no. 12, p. 1626, 2005, doi: 10.1136/HRT.2004.057307.
- ↑ 12.0 12.1 P. R. Rijnbeek et al., “Normal values of the electrocardiogram for ages 16-90 years,” J. Electrocardiol., 2014, doi: 10.1016/j.jelectrocard.2014.07.022.
- ↑ “Overview of the ECG Waves, Deflections, Intervals, Durations – ECG & ECHO.” https://ecgwaves.com/overview-of-the-ecg-waves-deflections-intervals-durations/ (accessed Dec. 21, 2020).
- ↑ “Paediatric ECG Interpretation • LITFL Medical Blog • ECG Library Basics.” https://litfl.com/paediatric-ecg-interpretation-ecg-library/ (accessed Dec. 21, 2020).
- ↑ S. S. Barold, “Willem Einthoven and the birth of clinical electrocardiography a hundred years ago,” Card. Electrophysiol. Rev., vol. 7, no. 1, pp. 99–104, Jan. 2003, doi: 10.1023/A:1023667812925.
- ↑ “The ECG leads: electrodes, limb leads, chest (precordial) leads, 12-Lead ECG (EKG) – ECG & ECHO.” https://ecgwaves.com/topic/ekg-ecg-leads-electrodes-systems-limb-chest-precordial/ (accessed Dec. 22, 2020).
- ↑ R. Rajaganeshan, C. L. Ludlam, D. P. Francis, S. V. Parasramka, and R. Sutton, “Accuracy in ECG lead placement among technicians, nurses, general physicians and cardiologists,” Int. J. Clin. Pract., 2008, doi: 10.1111/j.1742-1241.2007.01390.x
- ↑ J. Feher, “The Electrocardiogram,” in Quantitative Human Physiology, Elsevier, 2012, pp. 537–546.
- ↑ “ECG Lead positioning • LITFL Medical Blog • ECG Library Basics.” https://litfl.com/ecg-lead-positioning/ (accessed Dec. 22, 2020).
- ↑ A. L. Goldberger, Z. D. Goldberger, and A. Shvilkin, “ECG Leads,” in Goldberger’s Clinical Electrocardiography, 2018.
- ↑ S. Meek and F. Morris, “Introduction. I—Leads, rate, rhythm, and cardiac axis,” BMJ, 2002, doi: 10.1136/bmj.324.7334.415.
- ↑ S. Meek and F. Morris, “Introduction . II — Basic terminology QRS complex,” Br. Med. J., 2002.
- ↑ A. L. Goldberger, Z. D. Goldberger, and A. Shvilkin, “ECG Leads,” in Goldberger’s Clinical Electrocardiography, Elsevier, 2013, pp. 16–25.
- ↑ R. Rajaganeshan, C. L. Ludlam, D. P. Francis, S. V. Parasramka, and R. Sutton, “Accuracy in ECG lead placement among technicians, nurses, general physicians and cardiologists,” Int. J. Clin. Pract., 2008, doi: 10.1111/j.1742-1241.2007.01390.x.
- ↑ “MisLeading: The clinical implications of misplaced ECG leads - JEMS.” https://www.jems.com/operations/equipment-gear/misleading-clinical-implicatio/ (accessed Dec. 26, 2020).
- ↑ V. N. Batchvarov, M. Malik, and A. J. Camm, “Incorrect electrode cable connection during electrocardiographic recording,” Europace, vol. 9, no. 11. Oxford Academic, pp. 1081–1090, Nov. 01, 2007, doi: 10.1093/europace/eum198.
- ↑ K. Ishibashi, M. Takeda, Y. Yamahara, H. Shiraishi, T. Shirayama, and H. Matsubara, “Brugada syndrome associated with J waves in multiple leads and ‘pseudo-epsilon’ wiggle waves in lateral leads: Possible conduction delay in J-wave syndrome,” J. Arrhythmia, vol. 28, no. 4, pp. 228–231, 2012, doi: 10.1016/j.joa.2011.11.002.
- ↑ “Electrocardiogram | Johns Hopkins Medicine.” https://www.hopkinsmedicine.org/health/treatment-tests-and-therapies/electrocardiogram(accessed Dec. 13, 2020)
- ↑ “What is an electrocardiogram (ECG)? -Heart Matters magazine.” https://www.bhf.org.uk/informationsupport/heart-matters-magazine/medical/tests/electrocardiogram-ecg(accessed Dec. 13, 2020)
- ↑ “ECG interpretation: Characteristics of the normal ECG (P-wave, QRS complex, ST segment, T-wave) –ECG & ECHO.” https://ecgwaves.com/topic/ecg-normal-p-wave-qrs-complex-st-segment-t-wave-j-point/(accessed Dec. 13, 2020)
- ↑ M. Alpaslan, “pulmonary stenosis and the electrocardiography -ekg -ecg -ankara kardiyoloji -kalp hastalıkları -mete alpaslan -doktorekg.com.” https://www.metealpaslan.com/ecg/pulmdaren.htm(accessed Dec. 13, 2020)
- ↑ “prwpexamples1.jpg (PNG Image, 559 × 184 pixels).” https://m4.healio.com/~/media/learningsites/learntheheart/assets/e/e/4/5/prwpexamples1.jpg(accessed Dec. 13, 2020).
- ↑ J. G. Ramsay, “Cardiac management in the ICU,” 1999, doi: 10.1378/chest.115.suppl_2.138S.
- ↑ R. Auer et al., “Association of major and minor ECG abnormalities with coronary heart disease events,” JAMA - J. Am. Med. Assoc., 2012, doi: 10.1001/jama.2012.434.
- ↑ “Understanding Atrioventricular Blocks | CareerCert.” https://acls.com/free-resources/knowledge-base/bradycardia/understanding-atrioventricular-block (accessed Dec. 27, 2020).
- ↑ NIH, “Arrhythmia.” https://www.nhlbi.nih.gov/health-topics/arrhythmia (accessed Nov. 14, 2020).
- ↑ “Multifocal Atrial Tachycardia (MAT) • LITFL • ECG Library Diagnosis.” https://litfl.com/multifocal-atrial-tachycardia-mat-ecg-library/ (accessed Dec. 26, 2020).
- ↑ “Atrial Flutter training - ACLS Cardiac Rhythms video | ProACLS.” https://www.proacls.com/training/video/atrial-flutter (accessed Dec. 26, 2020).
- ↑ NHS, “Atrial Fibrillation.” https://www.nhs.uk/conditions/atrial-fibrillation/ (accessed Nov. 14, 2020).
- ↑ “ACLS Ventricular Fibrillation and Pulseless Ventricular Tachycardia Guide.” https://nhcps.com/lesson/acls-cases-ventricular-fibrillation-pulseless-ventricular-tachycardia/ (accessed Dec. 26, 2020).
- ↑ 41.0 41.1 41.2 41.3 T. I., T. N., T. R., K. M., and K. T., “Continuous remote monitoring of COPD patients—justification and explanation of the requirements and a survey of the available technologies,” Med. Biol. Eng. Comput., 2018.
- ↑ “ECG in Chronic Obstructive Pulmonary Disease • LITFL.” https://litfl.com/ecg-in-chronic-obstructive-pulmonary-disease/ (accessed Dec. 25, 2020).
- ↑ 43.0 43.1 T. J. Guzik et al., “COVID-19 and the cardiovascular system: implications for risk assessment, diagnosis, and treatment options,” Cardiovasc. Res., vol. 116, no. 10, pp. 1666–1687, Aug. 2020, doi: 10.1093/cvr/cvaa106.
- ↑ J. P. Lang, X. Wang, F. A. Moura, H. K. Siddiqi, D. A. Morrow, and E. A. Bohula, “A current review of COVID-19 for the cardiovascular specialist,” Am. Heart J., vol. 226, pp. 29–44, 2020, doi: https://doi.org/10.1016/j.ahj.2020.04.025.
- ↑ 45.0 45.1 45.2 R. B. Azevedo et al., “Covid-19 and the cardiovascular system: a comprehensive review,” J. Hum. Hypertens., 2020, doi: 10.1038/s41371-020-0387-4.
- ↑ 46.0 46.1 46.2 46.3 S. Jain et al., “Enhanced electrocardiographic monitoring of patients with Coronavirus Disease 2019,” Hear. Rhythm, 2020, doi: 10.1016/j.hrthm.2020.04.047.
- ↑ M. Rehman, A. Gondal, and N. U. Rehman, “Atypical Manifestation of COVID-19-Induced Myocarditis,” Cureus, vol. 12, no. 6, Jun. 2020, doi: 10.7759/cureus.8685.
- ↑ P. A. Lanfranchi and V. K. Somers, “Cardiovascular Physiology: Autonomic Control in Health and in Sleep Disorders,” in Principles and Practice of Sleep Medicine: Fifth Edition, Elsevier Inc., 2010, pp. 226–236.
- ↑ “Normal Electrocardiography (ECG) Intervals: Normal Electrocardiography Intervals.” https://emedicine.medscape.com/article/2172196-overview (accessed Jan. 03, 2021).
- ↑ S. Moodithaya and S. T. Avadhany, “Gender differences in age-related changes in cardiac autonomic nervous function,” J. Aging Res., vol. 2012, 2012, doi: 10.1155/2012/679345.
- ↑ G. A. Lanza, P. Pedrotti, A. G. Rebuzzi, V. Pasceri, G. Quaranta, and A. Maseri, “Usefulness of the addition of heart rate variability to Holter monitoring in predicting in-hospital cardiac events in patients with unstable angina pectoris,” Am. J. Cardiol., vol. 80, no. 3, pp. 263–267, Aug. 1997, doi: 10.1016/S0002-9149(97)00343-3.
- ↑ “ECG and HRV of a subject under normal and high cognitive condition. | Download Scientific Diagram.” https://www.researchgate.net/figure/ECG-and-HRV-of-a-subject-under-normal-and-high-cognitive-condition_fig2_331004481 (accessed Jan. 03, 2021).
- ↑ “Holter Monitor | Johns Hopkins Medicine.” https://www.hopkinsmedicine.org/health/treatment-tests-and-therapies/holter-monitor (accessed Dec. 10, 2020).
- ↑ M. Campos, “Heart rate variability: A new way to track well-being,” 2017. https://www.health.harvard.edu/blog/heart-rate-variability-new-way-track-well-2017112212789 (accessed Nov. 15, 2020).
- ↑ M. van Deusen, “Everything You Need to Know About Heart Rate Variability (HRV),” 2019. https://www.whoop.com/thelocker/heart-rate-variability-hrv/ (accessed Nov. 14, 2020).
- ↑ 56.0 56.1 F. Shaffer and J. P. Ginsberg, “An Overview of Heart Rate Variability Metrics and Norms,” Front. Public Heal., vol. 5, p. 258, Sep. 2017, doi: 10.3389/fpubh.2017.00258.
- ↑ C. A. Camillo et al., “Heart rate variability and disease characteristics in patients with COPD,” Lung, vol. 186, no. 6, pp. 393–401, Dec. 2008, doi: 10.1007/s00408-008-9105-7.
- ↑ L. C. M. Vanderlei, C. M. Pastre, R. A. Hoshi, T. D. de Carvalho, and M. F. de Godoy, “Basic notions of heart rate variability and its clinical applicability,” Brazilian J. Cardiovasc. Surg., vol. 24, no. 2, pp. 205–217, 2009, doi: 10.1590/s0102-76382009000200018.
- ↑ M. Bolanos, H. Nazeran, and E. Haltiwanger, “Comparison of heart rate variability signal features derived from electrocardiography and photoplethysmography in healthy individuals,” in Annual International Conference of the IEEE Engineering in Medicine and Biology - Proceedings, 2006, vol. 2006, pp. 4289–4294, doi: 10.1109/IEMBS.2006.260607.
- ↑ S. Sieciński, P. S. Kostka, and E. J. Tkacz, “Heart rate variability analysis on electrocardiograms, seismocardiograms and gyrocardiograms on healthy volunteers,” Sensors (Switzerland), vol. 20, no. 16, pp. 1–16, Aug. 2020, doi: 10.3390/s20164522.
- ↑ 61.0 61.1 M. J. Reed, C. E. Robertson, and P. S. Addison, “Heart rate variability measurements and the prediction of ventricular arrhythmias,” QJM, vol. 98, no. 2, pp. 87–95, Feb. 2005, doi: 10.1093/qjmed/hci018.
- ↑ G. T. Taye, E. B. Shim, H.-J. Hwang, and K. M. Lim, “Machine Learning Approach to Predict Ventricular Fibrillation Based on QRS Complex Shape,” Front. Physiol., vol. 10, p. 1193, Sep. 2019, doi: 10.3389/fphys.2019.01193.
- ↑ E. Agliari, A. Barra, O. A. Barra, A. Fachechi, L. Franceschi Vento, and L. Moretti, “Detecting cardiac pathologies via machine learning on heart-rate variability time series and related markers,” Sci. Rep., vol. 10, no. 1, p. 8845, 2020, doi: 10.1038/s41598-020-64083-4.
- ↑ D. Nabil and F. Bereksi Reguig, “Ectopic beats detection and correction methods: A review,” Biomed. Signal Process. Control, vol. 18, pp. 228–244, 2015, doi: https://doi.org/10.1016/j.bspc.2015.01.008.
