HRV:Cardiorespiratory Monitors
Home Lab Members Physiological Systems Monitoring Parameters in the ICU ECG HRV Clinician's Perspective Cardiorespiratory Monitors Signal Processing Deliverables Journal Abbreviations
Cardiorespiratory Monitors/Devices
Cardiorespiratory monitors are frequently used in the Intensive Care Unit (ICU), ambulances, emergency departments, the neonatal ICU and anaesthetics. They can be categorised by the parameters that they measure, such as Bedside Monitors, Transport Monitors and Remote Monitors. These different types of monitors specialise for certain functions according to the parameters that they detect.
Here is a document which looks at a variety of devices researched: Media:Cardiorespiratory_monitors_list.pdf
General Functions:
- Monitoring patient state and condition[1]
- Identification and diagnosis of underlying cardiorespiratory diseases
- Direct the decision of appropriate treatment[2]
- Warn medical staff of abnormalities in patient condition (if parameters go out of limits) through an alarmwikipedia[2]
- Monitoring general health and lifestyle
- Assess the condition and ability of athletes during training
- Monitor/screen
- Cables
- Electrode patches
- Pressure transducers
- Pulmonary artery catheter
- Arterial blood saturation probe
- Blood pressure cuff
- Printer
- Alarms
- Defibrillators
A large variety of devices, used for cardiorespiratory measurements in ICUs today, were explored. Directly below is a brief overview of how they compare to one another.
Similarities:
- All monitors track similar parameters, which essentially contain all vital information e.g. EKG measurements, BP, HR, RR, etc.
- They automatically link results to an electronic medical record (EMR) system; i.e. actively sending data to the network or database of the hospital they are located at.
- Every monitor displays measurements visually, whether it be through a main monitor screen or an application.
- They feature compatibility with other medical devices used in a clinical setting.
Differences:
- Measurements are taken differently amongst different devices. This can be categorised into either invasive (e.g. inserting a needle into the skin) or non-invasive methods (e.g. non-contact sensors).
- Some devices are designed to be used remotely at the patient's home, whereas others require installation onsite at the hospital.
- There are variations on focused parameters. A monitor may simply store all parameters or highlight those related to BP for instance.
- Accuracy of each device depends on the number of leads available, possibly ranging from 1 to 12.
- They vary by the number of additional components involved, whether they are optional or compulsory.
- Intuitively, prices of devices vary based on their differences.
Bedside Monitors
In the ICU, bedside monitors are most commonly used. These have cables and sensors attached to the patient and warn medical staff when abnormal values arise. They measure the most complete set of parameters and tend to perform 12-lead ECG. As such, they tend to provide more accurate measurements. As patients need to be hooked up to the machine, they may not be portable. Examples of these monitors are shown below (Note: we may want to just summarise these in a table):
CARESCAPE Monitors (GE Healthcare)
The CARESCAPE B650 Monitor can be used in the PACU, OR, NICU and lower-acuity ICU. The software installed can be personalised according to the hospital unit the monitor is used in. Profiles can be made to tailor the conditions of different kinds of patients (e.g. child, adult, elderly, etc.) [3].
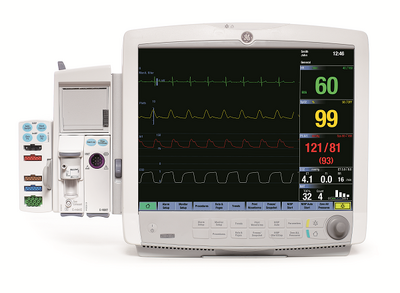
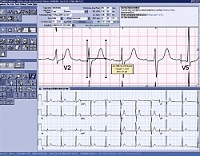
The parameters measured are NMT (nuclear medicine teleradiology), entropy, EEG, anaesthetic agent measurements, volumetric CO2 and O22, PiCCO (pulse countour cardiac output), CO, SvO2 (mixed venous oxygen saturation) and dual SpO2.) [3]. Arrhythmia's can be detected using EK-Pro Arrhythmia Algorithm technology, which uses multiple leads to minimise false alarms.[5] Data can be wirelessly transmitted from the monitor to the MUSE Cardiology Information System, which allows clinicians to annotate pacemaker pulses , compare ECGs and edit reports[6].
HemoSphere Advanced Monitoring Platform (Edwards Lifesciences)
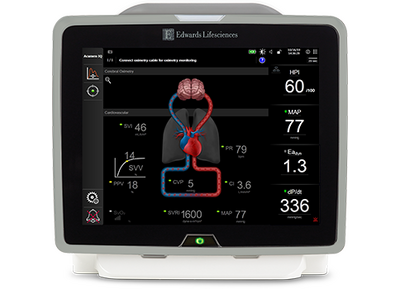
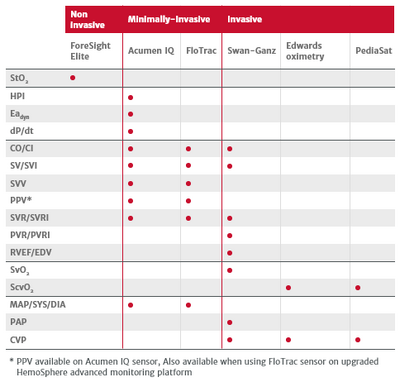
Edwards Lifesciences is the global leader in the science of heart valves and hemodynamic monitoring. They develop smart hemodynamic management solutions. The HemoSphere Advanced Monitoring Platform (Figure 6.1.2a) measures a wide range of advanced hemodynamic parameters in which clinicians use to make decisions in a variety of important clinical situations.
Function
This platform guides clinicians in proactive decision making in a range of clinical situations that requires maintenance of optimal patient perfusion such as:
- Cerebral desaturations
- Sepsis management
- Hypotension
- Hemodynamic instability
Features
1. Predictive decision support software
2. Compatibility with a range of other Edwards Lifesciences products
3. Track patient response to interventions
4. 8 screens:
- Goal positioning screen
- Graphical trend screen
- Graphical/Tabular trend split screen
- Physio-relationship screen
- Tabular trend screen
- Cockpit screen
- Physiology screen
- Brain screen
5. Modular design
6. Quick zero from cable
7.Hot swappable battery
8.Mobility
Parameters
The wide range of advanced hemodynamic parameters that can be measured by this monitoring platform when used together with other Edwards Lifesciences products is shown in Figure 6.1.2b.
EarlySense Vitals Surveillance System (Hill-Rom)
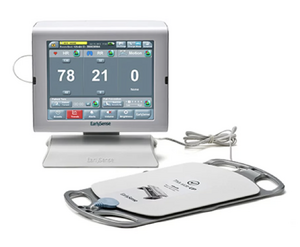
As a global medical device company, Hill-Rom develops a wide range of HRV monitors, and features a few on the homepage of their website - one of them namely the EarlySense Vitals Surveillance System[9]. It displays HR, RR and quantitative motion if any is detected, through everchanging digital values (rather than through graphs as monitors usually do) (Figure 6.1.3a). This monitor features personalised verification for patients to register onto the device.
The most distinct feature of this monitor is its flat-board sensor. No direct contact with the patient is needed; instead the sensor is to be placed below a hospital bed, around the patient's chest area. Clearly such a set-up is very straightforward and not bothersome to patients at all.
Infinite Monitors (Draeger)
Comparison
The findings of a study carried out by GE Healthcare to compare the CARESCAPE B850 Monitor (GE Healthcare) and IntelliVue X3 (Philips) are summarised below:[10]
| CARESCAPE B850 Monitor | IntelliVue X3 |
|---|---|
| 4 leads (I, II, III and V1) | 2 leads (I and II) and configuring options |
| Fixed QRS sensitivity | Adjustable setting for QRS sensitivity |
| No ECG processing delay | 0.7-1s ECG processing delay |
| Wait 5s after last detected beat to sound alarm | Fixed filtering delay of 1s and waits up to 4s to alarm |
| No false asystole alarms | One false asystole alarm for every 210 monitoring hours |
| More false tachycardia alarms | More false ventricular tachycardia alarms |
Table 6.1.5a: A comparison between the CARESCAPE B850 and IntelliVue X3 Monitors
The differences in the results arised from the number of leads of the monitors. As the IntelliVue X3 has fewer leads, it has to be more sensitive, which leads to more false alarms. A greater number of false alarms was also caused by the shorter period of time before the IntelliVue triggered an alarm. However, due to the ECG processing delay, the IntelliVue X3 fared better than the CARESCAPE B850 monitor when the input signals were noisy.
Monitors used during Procedures
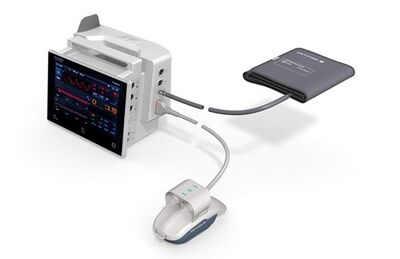
Getinge – NICCI The NICCI technology provides continuous blood pressure measurement of dynamic parameters such as mean arterial pressure, cardiac index, stroke volume variation and pulse pressure variation. It is unique in that it has a 2-finger sensor, rather than one so that measurements can be taken on each finger extending the amount of time it can be used for. It also comes in different sizes. The cuff of the sensor docks on a mouse which fits in the patient's palm to create better comfort. The cuff option has integrated NIBP calibration which is automatic calibration to the gold standard when using the cuff. It is mainly used during surgeries or other medical procedures[11].
Transport Monitors
We shall define transport monitors as those that are used during patient transport in the hospital or in ambulances. Transport monitors are more portable versions of bedside monitors, so they may not measure as many parameters. The following section will describe different types of transport monitors and how they compare to one another.
Some bedside monitors can double as transport monitors such as the Infinity Delta and Delta XL (Draeger)[12] and CARESCAPE One Monitor (GE Healthcare).[13] These transport monitors are used for transport within the hospital and monitor almost the same parameters as bedside monitors, though they are slightly smaller in size to increase portability.
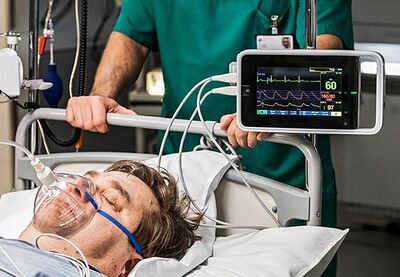
Figure 6.3a: CARESCAPE ONE Monitor[13]
Holter Monitor
The Holter monitor is a small, wearable decive which can continuously record ECGs for 24-48 hours[14]. It monitors the heart rhythm of patients with small electrodes which are attached to the skin[15].
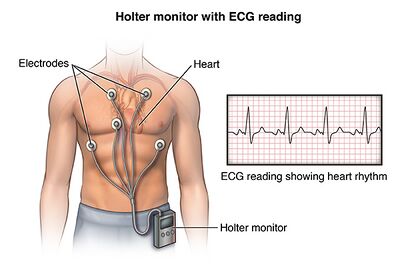
Figure 6.3b: Holter Monitor[16]
Event Monitor
An event monitor is similar to the Holter monitor. However, it records only for a few minutes for certain times[17]. Thus, it can be used for longer term monitoring, usually up to 30 days[17]. A patient can trigger a warning by pushing a button[17] if they feel symptomatic[15]. Some event monitors are programmed to trigger automatically if abnormalities are detected[15].
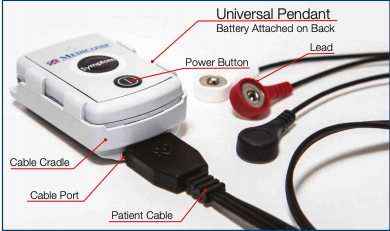
Figure 6.3c: Event Monitor[18]
Mobile Cardiac Telemetry
MCTs are used for longer term monitoring and can trigger events automatically or manually[15]. ECGs are sampled periodically throughout the day[15].
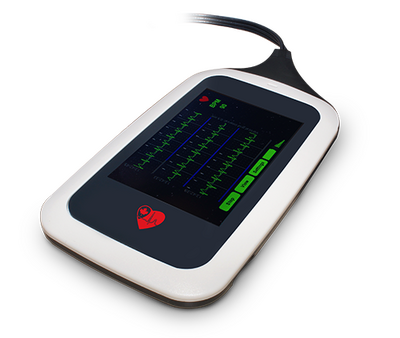
Figure 6.3d: Mobile Cardiac Telemetry[19]
TCAT3
TCAT3 stands for TELErhythmics Cardiac Ambulatory Monitoring and are similar to MCT. They also contain algorithms to trigger warnings automatically or via the patient pressing a button[15]. Additionally, real-time data can be transmitted wirelessly[15].
Figure 6.3e: TCAT3[20]
Comparison
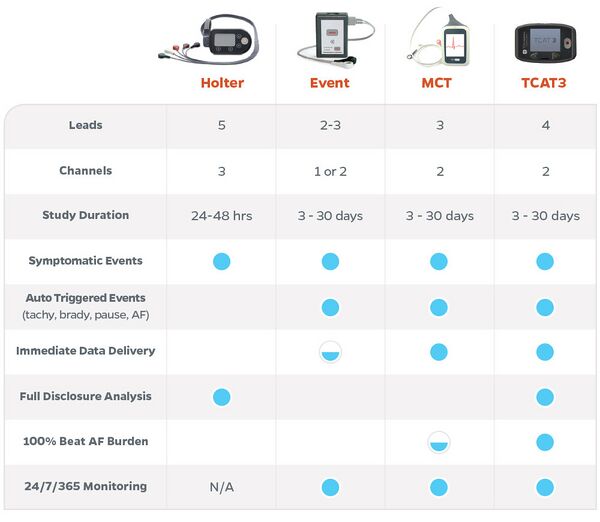
Figure 6.3f: Comparison between transport monitors[15]
Remote Monitors
Remote monitoring is becoming increasingly essential in today's world and its importance has been further proven through the Covid-19 pandemic. With remote monitoring, patients can be monitored outside the clinical environment, thereby reducing the time spent for clinical visits. Most remote monitors will record the patient's parameters throughout the day and data can be sent to clinicians wirelessly. Data is usually stored in an app (e.g. MyCareLink Heart Mobile App[21]), network (e.g. Merlin.net Patient Care Network[22]) or integrated into the hospital database (e.g. Infinity OneNet [23]). This allows real-time data analysis and warns clinicians of severe conditions.
Insertable Cardiac Monitors
Insertable cardiac monitors (ICMs) are used for long term continuous monitoring of a patient's HR and ECG. ICMs are beneficial as they do not disturb the patient's daily lifestyle and can send information directly to clinicians[24]. However, ICMs need to be inserted into the patient surgically, which carries some risk. As such, ICMs are recommended only for patients who have unexplained symptoms (dizziness, chest pain, etc.), are at risk of developing arrhythmias or have a previous record of atrial fibrillation[24].
Abbott - Confirm Rx ICM
The Confirm Rx ICM (Fig 6.3.1a) monitors the patient's heart beat, identifies abnormalities and reports them via Bluetooth and cellular data/Wifi[24]. It uses SharpSense Technology to increase the speed and accuracy of arrhythmia detection[25]

Figure 6.4.1a: Abbott's Confirm Rx ICM[24]
Procedure[26]:
- Confirm Rx is placed under the skin over the heart
- Device is paired with myMerlin mobile app (Fig 6.3.1b)
- Data is automatically sent from the myMerlin mobile app to the clinician or captured by the patient when feeling symptomatic
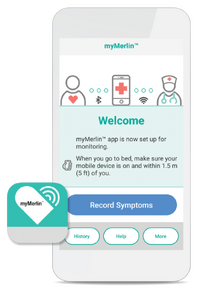
Figure 6.4.1b: myMerlin mobile app paired with Abbott's Confirm Rx ICM[27]
Wearable Health Devices
Wearable health devices (WHDs), or sometimes simply known as wearables, are becoming increasingly popular as people have started paying greater attention to their health and lifestyle.
The functions[28] of WHDs are listed below:
- Self-health tracking of activity/fitness/sleep level
- Help clinicians in earlier diagnosis and guide treatment of patients
- Continuous real-time monitoring of vital signs during daily activities and outside the clinical environnment
- Ambulatory monitoring for first responders
- Potentially gather data in the military and space
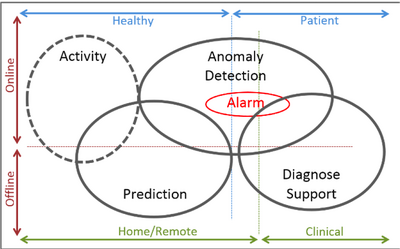
Figure 6.4.2a: Functions of wearable devices[28]
Benefits of WHDs[28]:
- Minimise the discomfort and interference of daily activities (usually non-invasive)
- Improve the early detection of AF
- Wirelessly communicate data to a centralised or external app/system
- Monitor patients in all environments
- Faster and earlier response during emergencies
The parameters[28] commonly monitored by today's monitors are: HR, BP, RR, blood SpO2, capnography, SV, ECG and glucose
There are many different types (Fig 6.3.2a) of wearables, which can be used on the eyes, ears, wrist, chest and ankle. These will be further discussed in the following subsections.
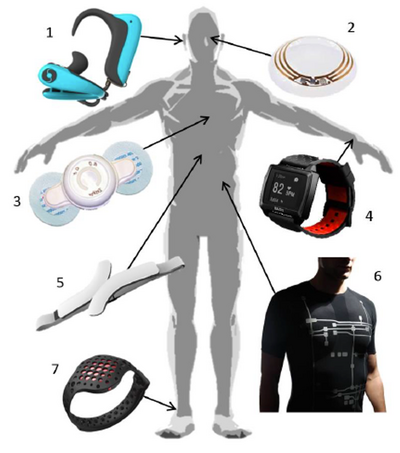
Figure 6.4.2b: Types of WHDs. (1) SensoTRACK ear sensor; (2) Google Contact Lens; (3) BioPatchTM; (4) Smartwatch Basis PEAKTM; (5) QardioCore; (6) Vital Jacket® t-shirt; (7) Moov (activity tracker)
taken from Dias et al.[28]
Watches
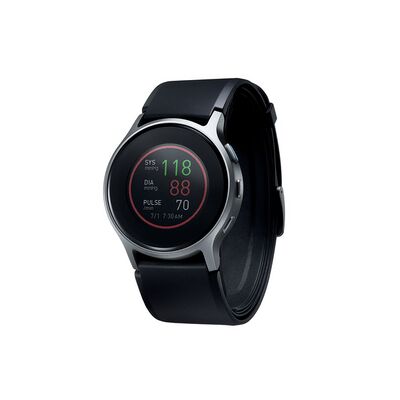
Omron – HeartGuide
It is a wearable blood pressure monitor which is used with its companion app HeartAdvisor. It is unique in the fact that it has 80 new patents which have been used to miniaturize the components of traditional oscillometric measurement inflatable cuffs into the watch band to take blood pressure readings. Other wearable technology only relies on sensor technology which only provides blood pressure estimates whereas HeartGuide records blood pressure to clinical accuracy in 30 seconds. It can also be used to track sleep and activity so the wearer can adjust their lifestyle accordingly [29].
Apple Watch
The Apple Watch (AW) is a smartwatch used for sports or daily activities and is capable of tracking health parameters and sending this data to the Health app on a paired iPhone or iPad. The AW can monitor HR as well as send notifications if the user's resting HR exceeds the lower or upper threshold for a certain amount of time.[30] AW Series 4, 5 and 6 are also able to record one lead ECGs via the ECG App[31] and is an FDA class 2 medical device for detecting AF[32]. Blood volume changes are measured using green light-based photoplethysmography (PPG) and ECGs are recorded via electrodes on the back or crown of the watch[33]. ECG abnormalities are then classified into 5 categories: sinus rhythm, AF, low HR (e.g. sinus bradycardia), high HR and inconclusive. A clinical trial conducted by Apple has shown that the AW has a 99.6% specificity for classifying sinus rhythm and 98.3% sensitivity in detecting AF[31].
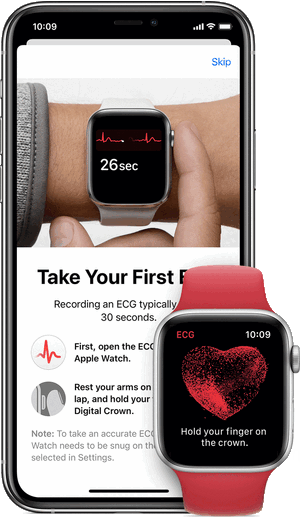
Figure 6.4.2.1b: Apple Watch and ECG App[31]
A study conducted by Nabeel et al. provides evidence of the accuracy of the AW Series 4 in recording ECGs and classifying them based on abnormalities[33]. The ECG interval measurements were compared between the AW (1 lead) and Philips Page-Writer TC70 ECG machine (12 lead). The results showed that there was a 100% concordance rate for automated sinus rhythm interpretation and there were no false positives of AF or high HR[33]. Between ECG recordings from the two devices, there was a strong correlation, meaning less than 20ms difference, in the PR and QRS intervals[33]. Additionally, the RR, QT and QTc intervals had a moderate correlation of less than 40ms difference<[33]. The AW can be improved to perform better with noisy signals due to movements and muscle contractions[33].
Future applications[33] of the AW include:
- identifying more types of heart problems (first-degree AV blocks, second-degree AV blocks, narrow-complex tachycardia and wide-complex tachycardia)
- Sharing of ECG events with clinicians to provide more data for analysis and diagnosis of arrhythmias
- Outpatient and ambulatory monitoring
ECG T-Shirt
ECG T-shirts are clothing worn by users which include embedded electronics or are made from smart textiles to record ECGs[28]. They are mainly used for monitoring in daily life or sports.
The first ECG T-shirt, the Georgia Tech Wearable Motherboard[34], was made in 1996 and could measure temperature, HR and respiration[28]. Initially, the shirt was created for use in combat casualty care, first responders and astronauts[28], but potentially could be applied in telemedicine and post-operative recovery monitoring and for athletes and law enforcement[34].
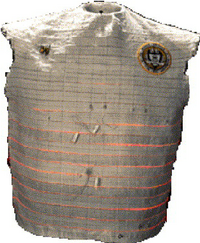
Figure 6.4.2.2a: Georgia Tech Wearable Motherboard[34]
ECG T-shirts from different companies/labs vary in their functions and number of leads(1, 3, 5 and 15) they contain[28]. The table below, adapted from Dias et al., shows examples of ECG T-shirts and the commercial clearance/approval[28]>:
| T-shirt Device | Market Clearance | ISO Standards |
|---|---|---|
| nECG TEXTILE | CE Mark; MDD-93/42/EEC | ISO13485; ISO9004 |
| Vital Jacket | CE Mark; MDD-93/42/EEC | ISO13485; ISO9004 |
| Smartex WWS | - | - |
| hWearTM | FDA; CE Mark | - |
| FIT ECG Shirt | - | - |
Table 6.4.2.2a: List of ECG T-shirts and their approvals or certifications
Other Wearables
Most of the devices shown below are available to the general public through retailers such as Amazon. Most of these devices are robust, small and very user-friendly. They work through Photoplethysmography (PPG), a method that detects volumetric changes in the peripheral blood circulation at the skin surface [35].
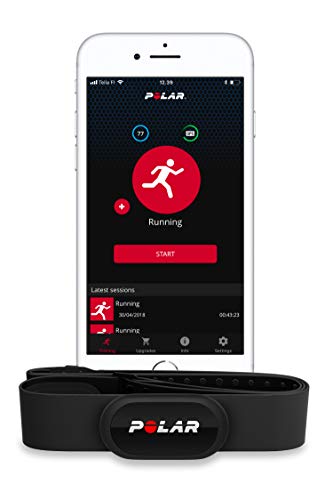
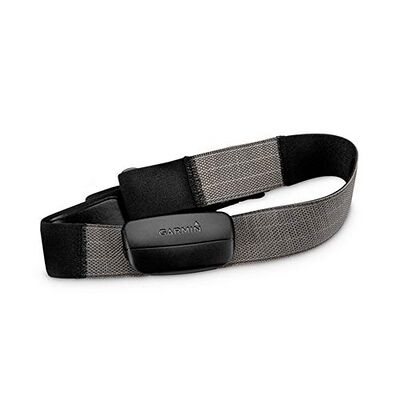
Although convenient, wearable devices do not necessarily provide an accurate insight into HRV in conditions such as exercise and extreme sport, where similarity drops when compared to gold-standard HRV measuring devices, such as those deriving HRV from ambulatory ECG readings. [38]
Specialty Monitors
This section focuses on monitoring devices that measure a specific parameter.
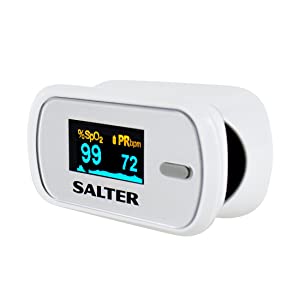
Pulse Oximeters
Arterial Blood Gas Test
Background and Basics
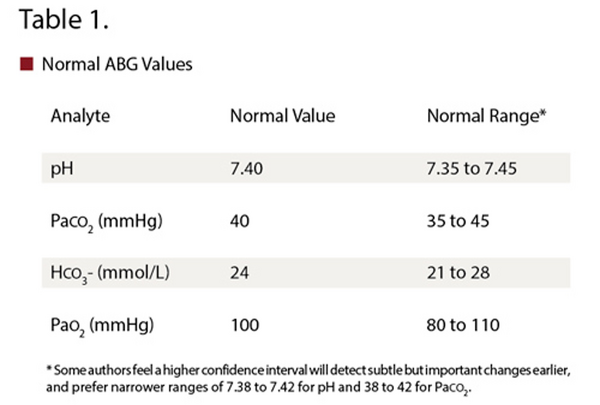
Blood pH needs to be closely monitored as the biochemical reactions in the body require a pH of around 7.40 for ideal function. A pH below 7.35 indicates an acidaemia, and a pH of above 7.45 an alkalemia. An arterial-blood gas (ABG) test provides good insight into the acid-base balance in the body.
An ABG test is an incredibly useful tool to measure the levels of gases, such as oxygen and carbon dioxide, in the blood. It shows how well the patient’s lungs are functioning and how well they can exchange gases, [39] and as such, it is often used in the ICU for very unwell patients, particularly in those with COPD or asthma exacerbations. [40]
Normal values for parameters commonly measured via ABG are shown in Table 1 below. Deviations in the levels of these parameters are indicative of acid-base disorders, which can be detrimental, and often have adverse consequences on the body.
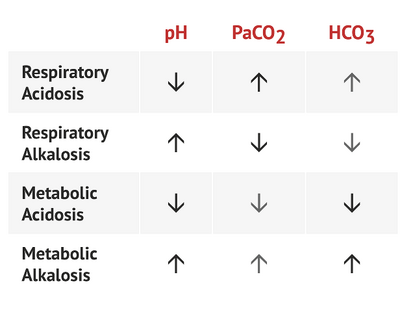
It is important to accurately interpret ABGs and laboratory tests in patients with these disorders to allow proper diagnosis and treatment. In general, metabolic processes affect bicarbonate levels, and respiratory disorders change PaCO2 levels [42] . General guidelines for diagnosing the type of acid-base disorder are found in the table below.
Measurement
It is carried out by drawing blood from the arm, usually from the radial artery, but blood can also be drawn from the femoral artery in the groin. [44]
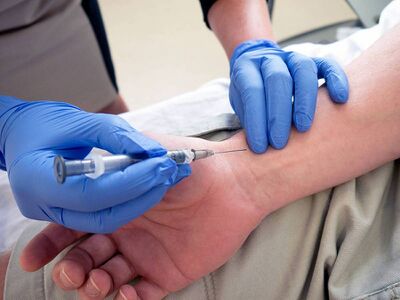
Whilst the traditional way of monitoring ABGs is through intermittent blood sampling, this method proves problematic in numerous ways, one of which is substantial blood loss in the patient. [46] Despite these issues, ABGs remain one of the most frequently ordered tests in for ICU patients [47]. However, as it is very difficult to obtain multiple samples a day from patients, ABG parameters such as PaO2 are obtained through less sophisticated equipment, such as pulse oximeters. However, these aren’t dependable in extremely ill patients, such as those with hypothermia. [48] Therefore, the need for less invasive techniques is apparent, as is the gap in continuous monitoring of ABGs.
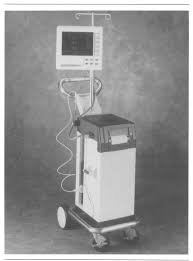
Continuous assessment of ABGs can be done through blood gas monitors, or blood gas analysers, which are defined as `patient-dedicated apparatus used to measure arterial pH, PaCO2 and PaO2 without permanently removing blood samples' [50] These monitors are based on either electro-chemical principles, or optical principles. [51]. One type of these monitors are Intra-Arterial Blood Gas Monitors (IABG), which have sensors that are directly injected into the bloodstream, thus providing continuous monitoring. The PB 3300 IABG Monitoring System has been shown to be highly precise for PaO2, PaCO2 and pH. [52] However, this system has downfalls such as extremely fragile sensors, [53] thus the issue in continuous ABG monitoring has not been solved.
Hence, improving care in the ICU can be done through improvement of the techniques available for measuring ABGs.
References
- ↑ 1.0 1.1 Cardiac Monitor. https://www.surgeryencyclopedia.com/A-Ce/Cardiac-Monitor.html#:~:text=thepatient’s bedside.-,Purpose,forpatient diagnosis and treatment. Accessed 28 Oct. 2020
- ↑ 2.0 2.1 https://en.wikipedia.org/wiki/Cardiac_monitoringBedside
- ↑ 3.0 3.1 https://www.gehealthcare.com/products/patient-monitoring/patient-monitors/carescape-monitor-b650
- ↑ http://www.medhold.co.za/products/patientmonitors/carescape-b650-patient-monitor/
- ↑ https://clinicalview.gehealthcare.com/quick-guide/maximizing-arrhythmia-detection-ek-pro-arrhythmia-algorithm
- ↑ https://www.gehealthcare.co.uk/products/muse-v9
- ↑ https://www.anandic.com/en/Clinical-Information-Systems/MUSE/page35073.htm
- ↑ 8.0 8.1 “HemoSphereadvanced monitoring platform | Edwards Lifesciences.” https://www.edwards.com/gb/devices/hemodynamic-monitoring/hemosphere (accessed Nov. 14, 2020).sss
- ↑ 9.0 9.1 EarlySense Vitals Surveillance System | Hillrom. (n.d.). Retrieved December 15, 2020, from https://www.hillrom.com/en/products/earlysense-vitals-surveillance/
- ↑ https://www.gehealthcare.com/-/jssmedia/b13d48bc6df74beda3c88a620b631d49.pdf
- ↑ 11.0 11.1 “NICCI Technology.” https://www.getinge.com/uk/product-catalog/nicci-technology/(accessed Dec. 13, 2020).
- ↑ ‘Infinity® Delta and Delta XL’. https://www.draeger.com/en-us_us/Products/Infinity-Delta-Series(accessed Nov. 23, 2020).
- ↑ 13.0 13.1 “CARESCAPE ONE Monitor | Patient Monitoring | GE Healthcare.” https://www.gehealthcare.com/products/patient-monitoring/patient-monitors/carescape-one (accessed Dec. 16, 2020).
- ↑ ‘Electrocardiogram (ECG or EKG) -Mayo Clinic’. https://www.mayoclinic.org/tests-procedures/ekg/about/pac-20384983(accessed Dec. 10, 2020).
- ↑ 15.0 15.1 15.2 15.3 15.4 15.5 15.6 15.7 ‘How to compare cardiac monitoring options | Digirad’. https://www.digirad.com/compare-cardiac-monitoring-options/(accessed Dec. 10, 2020).
- ↑ ‘Holter Monitor | Johns Hopkins Medicine’. https://www.hopkinsmedicine.org/health/treatment-tests-and-therapies/holter-monitor(accessed Dec. 10, 2020).
- ↑ 17.0 17.1 17.2 “Electrocardiogram (ECG or EKG) - Mayo Clinic.” https://www.mayoclinic.org/tests-procedures/ekg/about/pac-20384983 (accessed Dec. 10, 2020).
- ↑ Online, “Event and MCT Procedures.” Accessed: Dec. 10, 2020. [Online]. Available: www.medicompinc.com.
- ↑ https://www.windsorcardiaccentre.com/mobile-cardiac-telemetry-mct.html
- ↑ https://telerhythmics.com/services/
- ↑ “MyCareLink Heart App | Medtronic.” https://global.medtronic.com/xg-en/mobileapps/patient-caregiver/cardiac-monitoring/mycarelink-heart-app.html (accessed Dec. 15, 2020).
- ↑ “Merlin.net Patient Care Network | Abbott.” https://www.cardiovascular.abbott/us/en/hcp/products/cardiac-rhythm-management/merlin-patient-care-network.html (accessed Dec. 15, 2020).
- ↑ “Infinity® OneNet.” https://www.draeger.com/en_seeur/Products/Infinity-OneNet (accessed Dec. 15, 2020).
- ↑ 24.0 24.1 24.2 24.3 Abbott, “Confirm Rx ICM.” https://www.cardiovascular.abbott/us/en/patients/living-with-your-device/arrhythmias/insertable-cardiac-monitor/confirm-rx-icm.html (accessed Nov. 02, 2020).
- ↑ “About the Confirm Rx Insertable Cardiac Monitor | Abbott.” https://www.cardiovascular.abbott/us/en/hcp/products/cardiac-rhythm-management/insertable-cardiac-monitors/confirm-rx/about.html (accessed Dec. 16, 2020).
- ↑ “Living with Confirm Rx Insertable Cardiac Monitor | Abbott.” https://www.cardiovascular.abbott/us/en/patients/living-with-your-device/arrhythmias/insertable-cardiac-monitor/confirm-rx-icm/ht-tab/how-it-works.html (accessed Dec. 16, 2020).
- ↑ “Confirm RxTM Insertable Cardiac Monitor (ICM) | Abbott Confirm RxTM ICM.” https://confirmyourrhythm.com/ (accessed Dec. 16, 2020).
- ↑ 28.00 28.01 28.02 28.03 28.04 28.05 28.06 28.07 28.08 28.09 D. Dias and J. Paulo Silva Cunha, “Wearable Health Devices-Vital Sign Monitoring, Systems and Technologies,” Sensors (Basel)., vol. 18, no. 8, p. 2414, Jul. 2018, doi: 10.3390/s18082414.
- ↑ 29.0 29.1 “HeartGuide.” https://www.omron-healthcare.co.uk/blood-pressure-monitors/heartguide.html(accessed Dec. 13, 2020)
- ↑ https://www.apple.com/healthcare/apple-watch/
- ↑ 31.0 31.1 31.2 https://support.apple.com/en-ca/HT208955#:~:text=The%20ability%20of%20the%20ECG,classification%20for%20the%20classifiable%20results.
- ↑ [1] “(No Title).” https://www.accessdata.fda.gov/cdrh_docs/reviews/DEN180044.pdf (accessed Dec. 16, 2020).
- ↑ 33.0 33.1 33.2 33.3 33.4 33.5 33.6 [1] N. Saghir, A. Aggarwal, N. Soneji, V. Valencia, G. Rodgers, and T. Kurian, “A comparison of manual electrocardiographic interval and waveform analysis in lead 1 of 12-lead ECG and Apple Watch ECG: A validation study,” Cardiovasc. Digit. Heal. J., vol. 1, no. 1, pp. 30–36, 2020, doi: https://doi.org/10.1016/j.cvdhj.2020.07.002.
- ↑ 34.0 34.1 34.2 http://www.gtwm.gatech.edu/
- ↑ J. Allen, “Photoplethysmography and its application in clinical physiological measurement,” Physiological Measurement. 2007, doi: 10.1088/0967-3334/28/3/R01. pubh.2017.00258.
- ↑ Online. Available from: https://www.amazon.co.uk/Polar-Monitor-Bluetooth-Waterproof-Sensor/dp/B07PM54P4N/ref=sr_1_3?adgrpid=51576225245&dchild=1&gclid=CjwKCAiA_eb-BRB2EiwAGBnXXgPmfOk_KPtGKJ-1i78qY_rR8HeYAGYm6vNum0Gik7G49Qejd5_LCRoCtkcQAvD_BwE&hvadid=259085765959&hvdev=c&hvlocphy=9045751&hvnetw=g&hvqmt=e&hvrand=5195219703939559956&hvtargid=kwd-315441805859&hydadcr=13217_1819325&keywords=garmin+premium+heart-rate+monitor&qid=1608136414&s=sports&sr=1-3&tag=googhydr-21 (accessed 13 December 2020)
- ↑ Online. Available from: https://www.amazon.co.uk/Garmin-Adult-Unisex-Premium-HRM-Dual-Bluetooth/dp/B07N3C5WRG/ref=sr_1_1?adgrpid=51576225245&dchild=1&gclid=CjwKCAiA_eb-BRB2EiwAGBnXXgPmfOk_KPtGKJ-1i78qY_rR8HeYAGYm6vNum0Gik7G49Qejd5_LCRoCtkcQAvD_BwE&hvadid=259085765959&hvdev=c&hvlocphy=9045751&hvnetw=g&hvqmt=e&hvrand=5195219703939559956&hvtargid=kwd-315441805859&hydadcr=13217_1819325&keywords=garmin+premium+heart-rate+monitor&qid=1608136414&s=sports&sr=1-1&tag=googhydr-21 (accessed 13 December 2020)
- ↑ K. Georgiou, A. V. Larentzakis, N. N. Khamis, G. I. Alsuhaibani, Y. A. Alaska, and E. J. Giallafos, “Can Wearable Devices Accurately Measure Heart Rate Variability? A Systematic Review,” Folia Med. (Plovdiv)., vol. 60, no. 1, Jan. 2018, doi: 10.2478/folmed-2018-0012.
- ↑ Arterial Blood Gases | University of Michigan Medicine. Available: https://www.uofmhealth.org/health-library/hw2343 (accessed Dec. 13 2020)
- ↑ E. R. McFadden and H. A. Lyons, “Arterial-Blood Gas Tension in Asthma,” N. Engl. J. Med., vol. 278, no. 19, pp. 1027–1032, May 1968, doi: 10.1056/NEJM196805092781901.
- ↑ Online, “Arterial Blood Gas Interpretation”. Available from: https://medschool.co/tests/abg (accessed Dec. 14 2020)
- ↑ P. K. Hamilton, N. A. Morgan, G. M. Connolly, and A. P. Maxwell, “Understanding acid-base disorders,” Ulster Medical Journal. 2017.
- ↑ Online, “THE ABCS OF ABGS: BLOOD GAS ANALYSIS”. Available from: https://rtmagazine.com/department-management/clinical/the-abcs-of-abgs-blood-gas-analysis (accessed Dec. 14 2020)
- ↑ S. P. Dev, M. D. Hillmer, and M. Ferri, “Arterial Puncture for Blood Gas Analysis,” N. Engl. J. Med., vol. 364, no. 5, p. e7, Feb. 2011, doi: 10.1056/NEJMvcm0803851.
- ↑ Know Your ABGs - Arterial Blood Gases Explained | Nurse.org. Available from: https://nurse.org/articles/arterial-blood-gas-test/ (accessed Dec. 14 2020)
- ↑ B. R. Smoller and M. S. Kruskall, “Phlebotomy for Diagnostic Laboratory Tests in Adults,” N. Engl. J. Med., vol. 314, no. 19, pp. 1233–1235, May 1986, doi: 10.1056/NEJM198605083141906.
- ↑ F. F. Muakkassa, R. Rutledge, S. M. Fakhry, A. A. Meyer, and G. F. Sheldon, “ABGs and arterial lines: The relationship to unnecessarily drawn arterial blood gas samples,” J. Trauma - Inj. Infect. Crit. Care, 1990, doi: 10.1097/00005373-199009000-00004.
- ↑ B. A. SHAPIRO and R. D. CANE, “Blood gas monitoring,” Crit. Care Med., vol. 17, no. 6, pp. 573–581, Jun. 1989, doi: 10.1097/00003246-198906000-00020.
- ↑ Online. Available from: salter warehouses.co.uk (accessed 14 December 2020)
- ↑ B. A. Shapiro, “In-vivo monitoring of arterial blood gases and pH,” 1992.
- ↑ P. Rolfe, “In vivo chemical sensors for intensive-care monitoring,” Med. Biol. Eng. Comput., vol. 28, no. 3, p. B34, May 1990, doi: 10.1007/BF02442679.
- ↑ M. HALLER, E. KILGER, J. BRIEGEL, H. FORST, and K. PETER, “Continuous intra-arterial blood gas and pH monitoring in critically ill patients with severe respiratory failure,” Crit. Care Med., vol. 22, no. 4, pp. 580–587, Apr. 1994, doi: 10.1097/00003246-199404000-00012.
- ↑ C. P. Larson Jr., “Continuous arterial blood gas monitoring: a technology in transition,” Intensive Care Med., vol. 22, no. 11, pp. 1141–1143, Nov. 1996, doi: 10.1007/s001340050228.
- ↑ T. Lumsden, W. R. Marshall, G. A. Divers, and S. D. Riccitelli, “The PB3300 intraarterial blood gas monitoring system,” J. Clin. Monit., vol. 10, no. 1, pp. 59–66, Jan. 1994, doi: 10.1007/BF01651467.
