Courtney L. Merriam Week 4
Purpose
This experiment was created in order to determine if the HIV virus strains extracted from four separate, random test subjects originated from the same HIV strain.
Methods and Results
Activity 2 Part 1:
- Upload the “visit_1_S1_S9.txt” and “visit_1_S10_S15.txt” files into the nucleic acid tool set of the Biology Workbench session created in the last exercise.
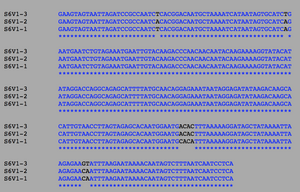
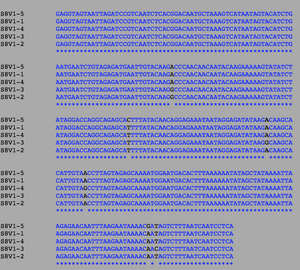
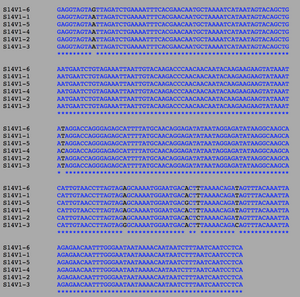
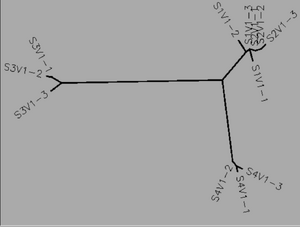
- Generate a multiple sequence alignment and distance tree for 12 of these sequences (3 clones from each of 4 subjects).
- SUBJECT 1
- S1V1-1
- S1V1-2
- S1V1-3
- SUBJECT 2
- S2V1-1
- S2V1-2
- S2V1-3
- SUBJECT 3
- S3V1-1
- S3V1-2
- S3V1-3
- SUBJECT 4
- S4V1-1
- S4V1-2
- S4V1-3
- SUBJECT 1
- Sketch the distance tree on paper so that you can make notes on it.
- See Data and File section
- Do the clones from each subject cluster together?
- Yes
- Do some subjects’ clones show more diversity than others?
- For subject 1 strain 1 shows more diversity than strains 2 and 3. For subject 2 strain 3 shows more diversity than stains 1 and 2. For subject 3 strain 3 shows more diversity than strains 1 and 2. For subject 4 strain 2 shows more diversity than strains 1 and 3.
- Do some of the subjects cluster together?
- Yes Subjects 1 and 2 really cluster together but subjects 1 2 and 4 also cluster together.
- Write a brief description of the tree and how to interpret the clustering pattern with respect to the similarities and potential evolutionary relationships between subjects’ HIV sequences.
- The unrooted tree shows the similarities of the 4 subjects and clones. The mutations 1 and 2 of subject 2's virus are very similar to the mutation 3 of subject 1 in comparison to mutation 1 and 1 of virus 1. Viruses 1 and 2 are much more similar to each other than the viruses 3 and 4
Activity 2 Part 2:
- Select all the clones from one subject and align them. From the alignment calculate S by counting the number of positions where there is at least one nucleotide difference across the collection of clones. Enter data into Table 3 See Data and Files section
- Import your alignment so that you can use it in a later section.
- Run the same analysis for a second and third subject and record your results in Table 1.
- Calculate θ for the three subjects chosen to work with and enter the results in the datable.
- Use the Clustdist tool in the alignment tool set to generate a distance matrix for an alignment saved.
- Select the highest and lowest pairwise scores and convert that percentage difference score into the raw number of differences by multiplying by the length of the sequence.
- Round to the nearest integer, record your results in Table 1 and repeat the analysis for the other 2 subjects.
- Create a new alignment with all of the sequences from 2 subjects.
- Use Clustdist to generate a pairwise distance matrix for the alignment across subjects and find the minimum and maximum differences between the subjects sequences. Remember, only at pairwise distances across subjects, not within one subject.
- Record data in Table 2 and repeat the analysis for the other pairs of subjects. See Data and Files section
Data and Files


Conclusion
This week's procedure was contrived to determine if the HIV virus strains extracted from random test subjects originated from the same initial virus. The table data and distance tree acquired during the experiment lead me to conclude that the viruses contained within each individual subject didn't come from the same original strain. The purpose of the experiment was completed as we used the data gathered to determine the relationship, or lack thereof, between the viruses extracted from the test subjects; the answer being: they are unrelated, and did not stem from the same viral source.
Defining Your Research Project
- What is your question?
- If HIV-1 virus evolution patterns are based on virus copy number rather than CD4 T-cell decline, how would this change the subjects classification as non-progressors, moderate progressors, and rapid progress ors? Is virus copy number correlated with diversity and divergence?
- Make a prediction (hypothesis) about the answer to your question before you begin your analysis.
- There would be a shift in the subjects being grouped as moderate and rapid progressors. There is an overlap in virus number copies in Table 1 for subjects in both of these groups.
- Which subjects, visits, and clones will you use to answer your question? Justify why you chose the subjects, visits, and clones you did.
- Using subjects 1, 3, 6, and 7 because they have very similar virus copy numbers. We could also close subjects 12 and 13 since their virus numbers are significantly lower.
Acknowledgments
I collaborated with Avery Vernon-Moore and in class on this assignment. While I worked with the people noted above, this individual journal entry was completed by me and not copied from another source.
- Courtney L. Merriam 21:29, 23 September 2016 (EDT):
References
[http://
Useful Links
Clas Page: Bioinformatics Laboratory
| Weekly Assignments | Individual Journal Assignments | Shared Journal Assignments |
|---|---|---|
|
|
|
