2020(S08) Lecture:week 10
<html> <style>#en2020 a {color:black;}</style> </html>
|
| Home | Lecture schedule |
Studio schedule |
Expectations |
| Week 1 Week 2 Week 3 Week 4 Week 5 Week 6 Week 7 | |||
| Week 8 Week 9 Week 10 Week 11 Week 12 Week 13 Week 14 | |||
| 20.902/20.947 | Student Resources | Teacher Resources |
Week 10 Tuesday
Not all engineers are pessimists but since good designs anticipate failure modes, many engineers must at least consider Murphy’s Law (what can go wrong will go wrong) as they flesh out the details of their designs. Like Daedalus’ wax wings flown too close to the sun, even designs that work well have limits and breaking points. If an engineered object is to work reliably, then the designers will have to carefully examine its multiple points of failure, including the three that today’s challenges address: extreme forces, performance variations, and human fallibility.
Challenge 1: Reliable materials/use
modified from a lesson described in Henry Petroski’s book, To Engineer is Human
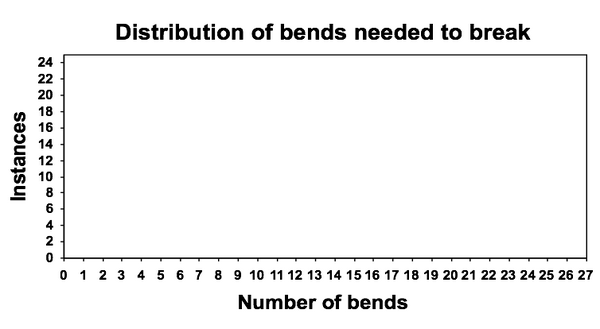
Boxes of paper clips don’t usually come with “ a money back guarantee” since nearly everyone in the world who uses paperclips finds them a reliable way to hold a few pieces of paper together. But bend the paperclip wide a few times and it’s likely to break. How many times will that be? We’ll do a quick experiment to find out. Each of you will bend a paperclip back and forth until it breaks and we’ll plot the data on a histogram.
Did all the paperclips break after the same number of bends? If so, why? If not, why not?
Reason 1:
Reason 2:
Mapping these ideas to your project
This paperclip challenge spotlights two modes of system failure, namely
- fatigue of the materials that comprise the device and
- application of uncharacteristic forces.
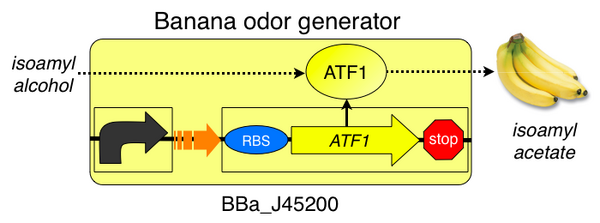
As you've seen these affect each paperclip to differing degrees. When thinking about biotechnologies, what is akin to “material fatigue”? What situations might be considered uncharacteristic? How cell to cell differences can be taken into account is touched on in the next challenge but here let's apply material and use variations to the Eau d’coli project from the MIT 2006 iGEM team. Recall, these bacterial cells were designed to smell like bananas when they reach stationary phase.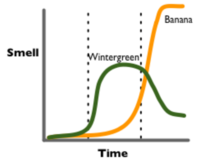
- In your groups imagine at least two ways that the genetic material in this system might "fatigue" and how you'd know.
- Next define at least two environmental conditions that would derail the system and decide how likely these conditions are.
Challenge 2: Reliable performance
The first challenge today addressed catastrophic failure--if breaking a paperclip can be called “catastrophic.” The activity makes clear how engineers can enhance reliability by anticipating then obviating failure modes. Certainly, weaknesses can be tested and quantified, leading to reliability terms such as the "MTTF" (Mean Time To Failure). And certainly there are simple things to try that lengthen “MTTF” such as specifying operating conditions (“don’t repeatedly bend the open clip back and forth") or including redundant functions (“use two paper clips when in doubt”). But catastrophic failure is only one way to fail. Today’s second challenge will consider another mode of failure, namely unreliable performance.
The framework presented here is attributed to Reshma Shetty and the thesis work she has undertaken in the labs of Tom Knight and Drew Endy. She has developed a framework for characterizing transcription-based logic devices that we will modify to talk about system-level behavior.
Digital vs Analog Logic
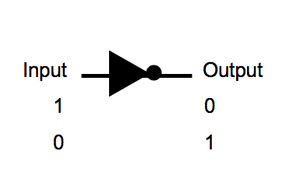
As our starting point we’ll consider the simplest Boolean logic gate, the inverter or NOT gate. This gate has just one input. When that input has a logical value = 1 the output of the inverter is logical value = 0. And when the input value is = 0, the output is =1. The truth table and transfer curve for such a digital logic device is shown:
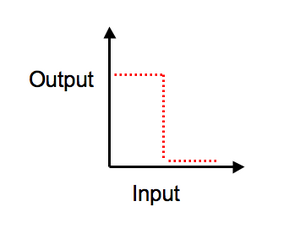

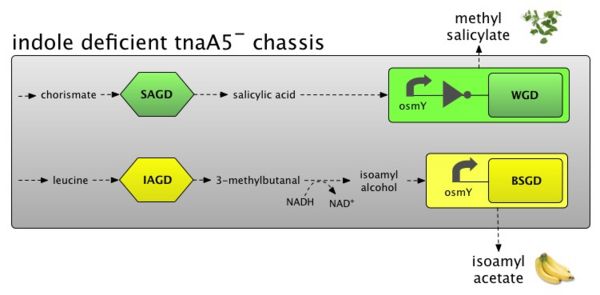
The inverter's transfer curve should remind you, just a little, of the shape of the curves we’ve already seen for the wintergreen and banana smell generators in the Eau d'coli project. Recall that the devices in this cell are controlled so that the wintergreen scent is generated only in log phase growth of the cell and the banana scent is generated only in stationary phase. The wintergreen scent, for instance, is programmed by a combination of a sensor (stationary phase promoter), a logic device (inverter), and an actuator (odor production). In fact if you examine the system level diagram that the team specified you'll see an inverter device regulating the conversion of salicylic acid to methyl salycilate.
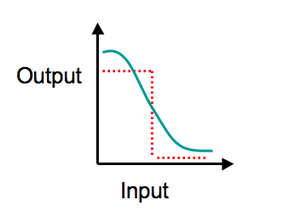
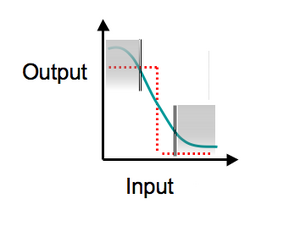
Mapping the log-to-stationary phase concentration of methylsalycilate (in green) to the digital transfer curve (in red), you can see that activity of the green boxed wintergreen-generating device is swinging from a high value to a low value but the trip point (the input value at which the device inverts the output signal) is not precise. To impose digital logic on the analog signal, we'll have to impose thresholds. Thresholds designate a value above which the input for the device will be given a logic value = 1 and below which the logic value will = 0. You'll note that the thresholds still leave some values that have unspecified consequences for the operation of the device. You'll also note that the steeper the slope of the curve, the more accurately the gated signals will perform.
Please note that we have modified a framework that's useful for characterizing individual devices (e.g. sensors, logic devices, actuators) in order to describe the behavior of a system built with those devices. We've done this to help think about reliability in performance. Once your understanding of this description is solid for the system overall, it's worth thinking about the performance of each device that comprises the system and what the error rates might be for each. An example of an input/output analysis for the stationary phase sensor itself and in combination with the inverter is here.
Performance Implications
In your group you should consider the following 3 questions
- When thinking about biological analog to digital converters, what aspects of biology should be taken into account? (NOTE: you can restrict your thinking to systems that are controlled by transcriptional logic)
- What would be the consequence of a 10% error in the logic output for the wintergreen generating device? Would this be a tolerable error rate for this system?
- Would a 10% error rate be acceptable for a device in your own project? Why or why not?
Challenge 3: Reliable sources
Here’s a story that’s been passed from teacher to teacher: 2 students spend the night before their big final exam at a party and they end up sleeping through the test. They tell the teacher that a flat tire is what kept them from the exam and the teacher, seemingly gullible, lets them retake the exam in separate rooms. The exam has only one question: which tire?
Very cute. Very clever. But is it true or urban myth? How do you know? Today you’ll have a chance to sniff out fact from fiction with a scientific game of “I doubt it.” You’ll hear three short stories from the scientific literature and you need to pick the fake one from the mix. This sniffing out of the truth will be harder than you might think. For one thing, these stories will be drawn from recent scientific developments and nature is incredibly imaginative. Consequently things that sound impossible turn out to be very real. In addition, there is often a personal set of beliefs that everyone works within, making stories that validate or reinforce those beliefs seem more plausible. One instance of such bias is the hoax article about climate change that many bloggers righteously touted as the truth revealed.
PS The tire story turns out to be largely true as reported by the Chronicle of Higher Education. Many thanks to Duke Chemistry Prof. James Bonk for a great, mostly true story to tell.
Week 10 Studio
Part 1: Eau d'coli early test/debug
Aye yay yay! Won't we ever get away from this Eau d'E coli project? Not yet! Take a close look at the device-level system diagram. You can't see all the underlying BioBrick parts (there are ~24 parts in total). If you were the designer of this system, do you think that the system would work if you just synthesized all the DNA as a single contiguous strand, transformed this new DNA into a cell, and let your genetic program rip!? Or, stated differently, what would be your next step if you tried to get everything working at once, and NOTHING HAPPENED, or, even worse, your engineered DNA killed the cell?
Having a plan for testing and debugging your projects is critical. To help you think about how to develop the best testing and debug plan for your 20.020 projects, spend the next 15' working with your team to outline a testing and debug plan for the Eau d'E.coli (EdC) system. Before you get started, designate one person on your team to act as your team's raconteur. Once the 15' are up, we'll ask each raconteur to amuse the class with an accurate description of your testing and debug plan.
- First, since you have a device level system diagram, sketch out a timing diagram for this project (use a white board).
- Second, given that you've just added all this DNA to the cell, and that nothing happened (no smell, or worse, all the cells died), how would you go about figuring out what aspects of the EdC project might be working, and what other components need to be revised or fixed?
- Finally, look again at the EdC device-level system diagram. Is there anything about the system's design that makes testing and debugging easier or harder than it might be otherwise? Would you like to change any aspects of the system design to make testing and debug easier?
Part 2: Project Redesign Day
Week 10 Thursday
Project work day!
