Kristoffer Chin: Week 4
From OpenWetWare
Jump to navigationJump to search
Entry
Activity 1
Part 2
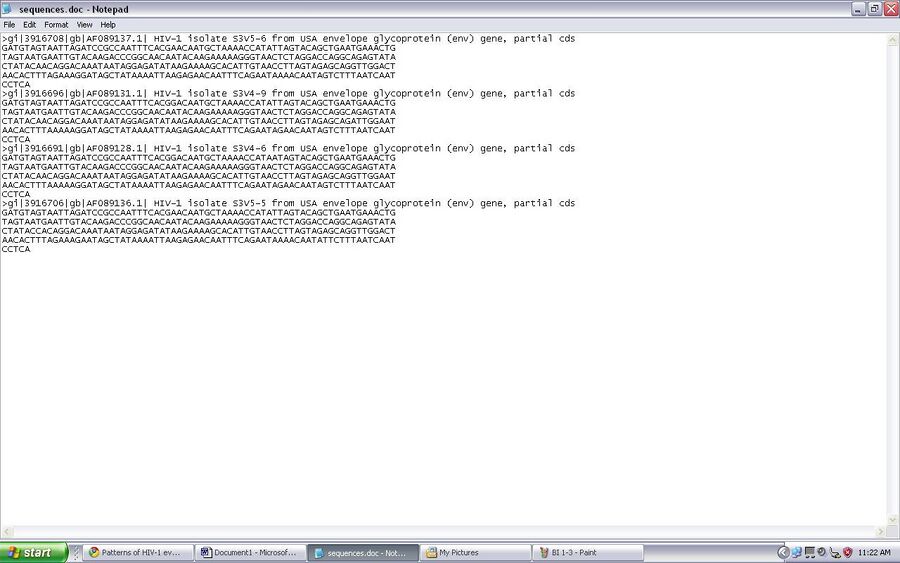
- I obtained the GenBank record online and saw difference sequences available to look at. I chose a random sequence available and save the sequence as a FASTA formatted sequence but opened the file using notepad
- The accession number of the sequence that I chose was AF089137.
- The subject of study that HIV sequence was from subject 3. The information that allowed me to know where the HIV sequence was taken from was on the title of the sequence. The title was S3V5-6, this means that it was from Subject 3 visit 5, clone 6.
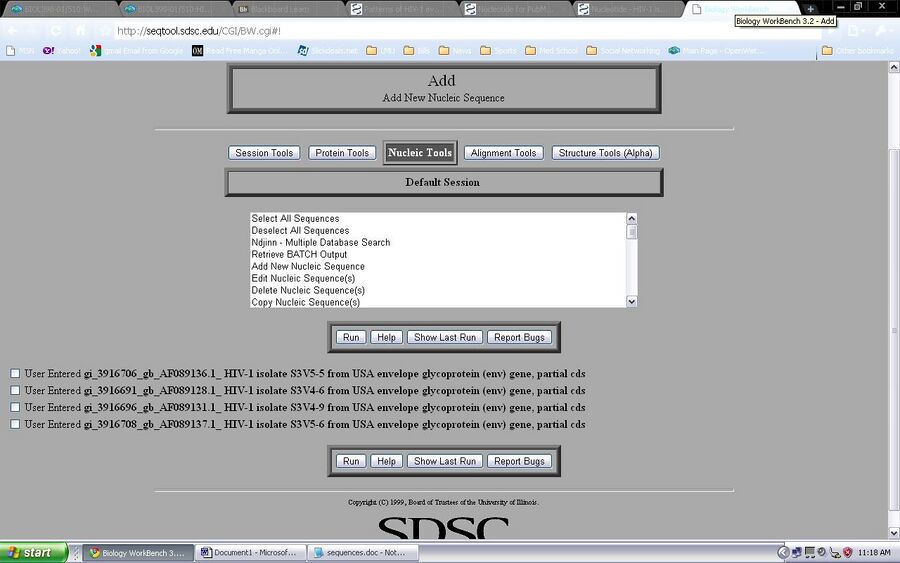
- These are the sequences that I chose
Part 3
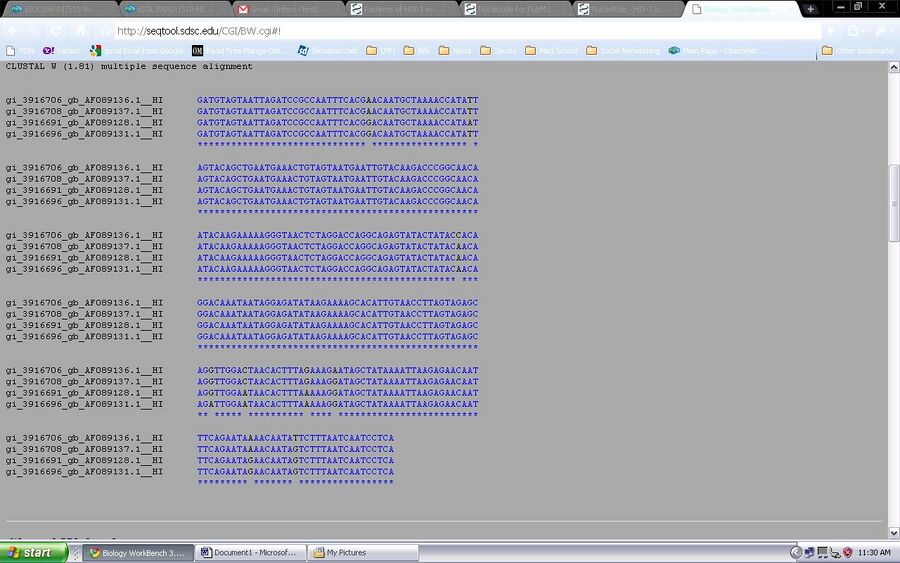
- This is an introduction to Biology Workbench, a bionformatics tool, [1]. An account must be made before using the tool. The chosen and saved sequences will be used on this program to generate a tree to visualize the diversity in the subjects. This is a test run in order to understand what is going on. First the sequences were loaded to the program from the nucleic sequence tool. they are then checked and the ClustalW tool is chosen.
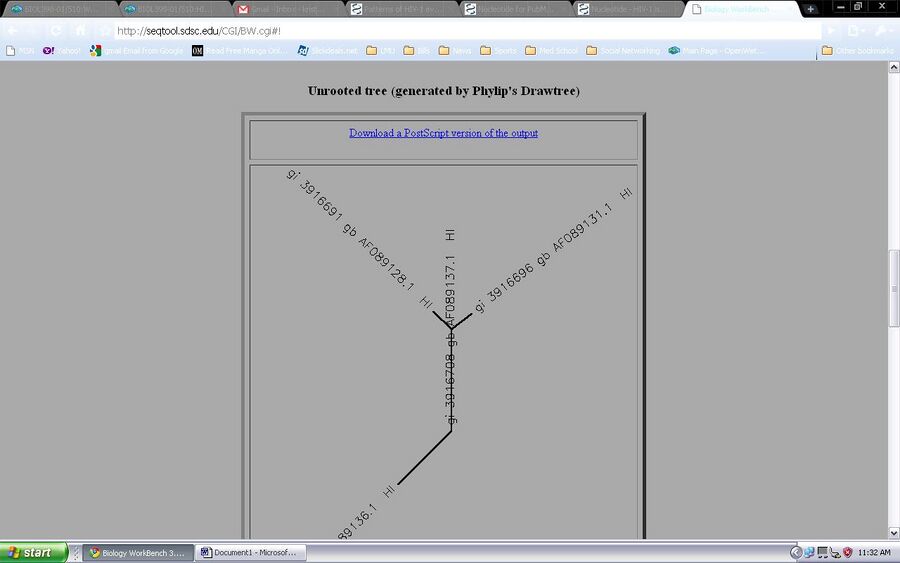
The ClustalW tool is ran and all four samples are observed through nucleic acid sequences and an unrooted tree diagram.
Activity 2
Part 1
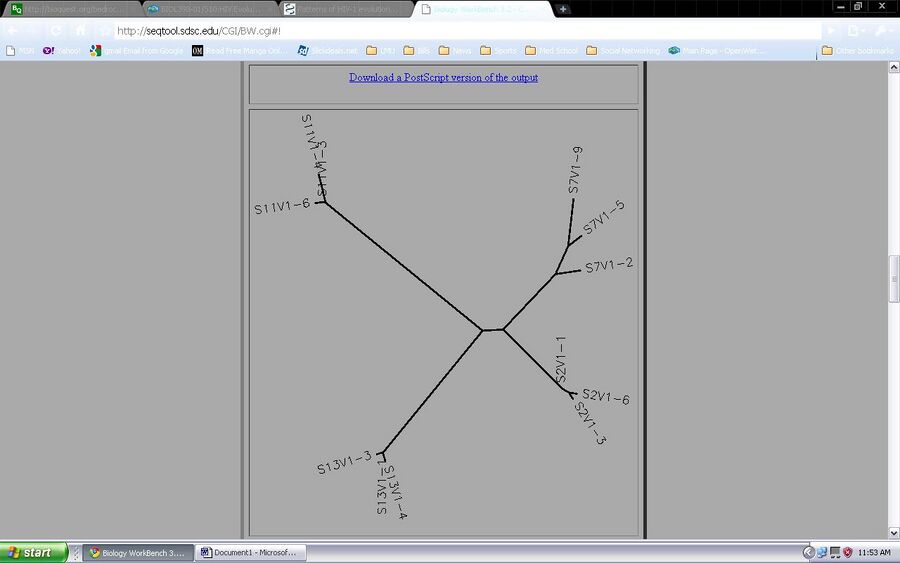
- Using Biology Workbench, the HIV sequences that were used in the experiment are used in order to observe the diversity of the clones from chosen subjects. It is to determine if the HIV evolutions comes from a common source. In this part of the activity it will be looked at through the use of unrooted trees from ClutalW tool. The Following sequences were observed and analyzed with the ClustalW tool: Subject 2, clones 1, 3, 6. Subject 7, clones 2, 5, 9. Subject 11, clones 3, 4, 6. Subject 13, clones 1, 3, 4.
- Yes, the clones from each subject cluster together.
- Yes, there are clones that show more diversity than others. The clones that show more diversity than other was found in subject 7.
- There are no subjects that cluster together but, subject 2 is close to subject 7
- The tree shows the cluster of clones of each subject. Subject 2 is close to subject 7, while subject 11 is the furthest from all three subjects. The lengths of the branches do show significant different allowing an evidence for group sequences. Subject 11 clone clusters are very close to each other. They are close that clones 3 and 4 seem to overlap each other. Subjects 3 and 2 also share the same case as subject 11. Subject 7’s clone cluster is different because each clone has its own branch. The clones do not seem to be as closely related as the other subjects. Looking at the tree, it seems that more diversity is found in subject 7 due to each clone having its own branch that has a significant length from each other.
Part 2
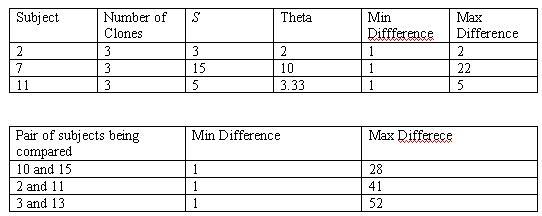
- Diversity can also be analyzed not only as a diagram, but also through numbers with the workbench tool. This part of the activity allows to quantify the sequences.
- The first table is the measurement of clones within a single subject
- The second table is the measurement of subjects
- S is the number of positions that vary, or are not identical, across all the sequences of the alignment
- Theta is the estimate of the average pairwise genetic distance
- Min and Max difference is the distances between any pair of sequences in an alignment
BIOL398-01: Bioinformatics Lab
- Lab Journal
- Shared Journal
- Assignments
