Kristoffer Chin: Week 12
From OpenWetWare
Jump to navigationJump to search
Entry
Normalize Log Ratios
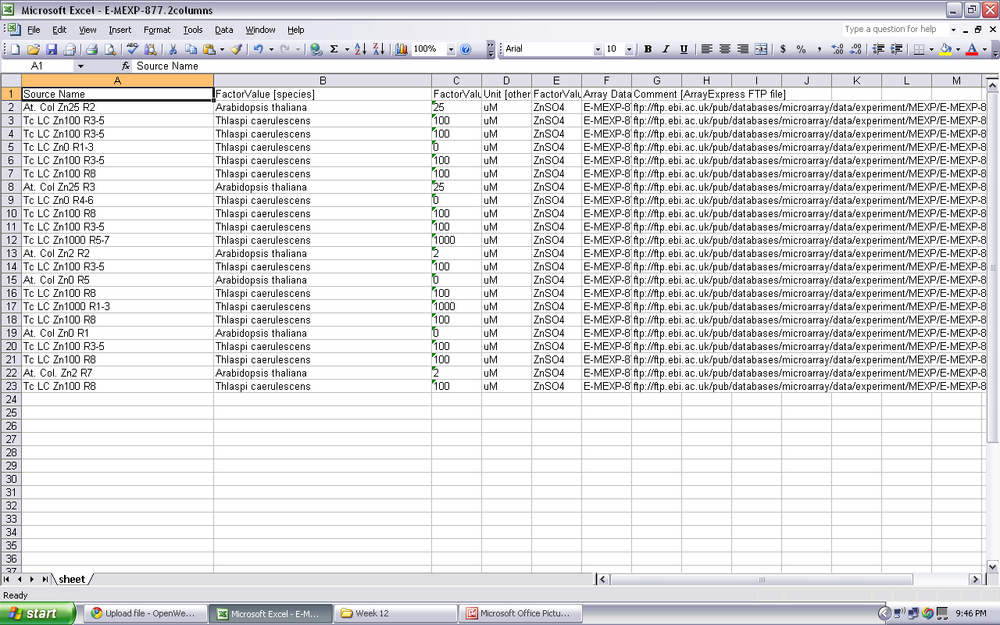
- The original data sheet did not contain the correct amount of names. We had too look at array express and the different excel sheets to find the correct names

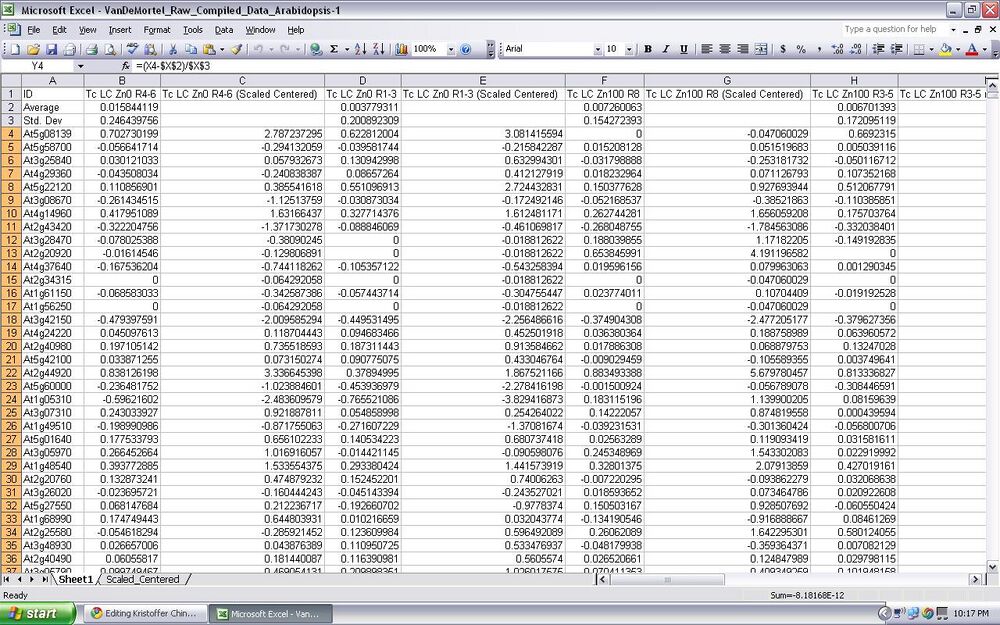
- After matching the names, the data from each of the different microarray subject was averaged using the excel formulas.
- The standard deviation was then found on the data as well
- New columns are then made with the same name of the subject along with scaled centered and is given data using the excel formulas

Statistical Analysis of Ratios
- The LOG average was found between TC and AT. These 2 subjects were averaged out and a .txt and xls. was made for GenMAPP and to refer to.
GenMAPP txt file GenMAPP xls file
Sanity Check
- 1711 genes were found to be <.05
- 326 genes were found to be <.01
- 34 genes were found to be <.001
- 0 genes were found to be <.0001
- 549 genes that are greater than 0 in Log Avg
- 1162 genes that are less than 0 in the Log Avg
- 1162 genes that are greater that 0.25 or less than 0.25 in the Log Avg.
BIOL398-01: Bioinformatics Lab
- Lab Journal
- Shared Journal
- Assignments