ISEEM Progress June 2009
| Home | Project | People | News | For Team | Calendar | Library |
I. Progress made toward completion of our goals
A. Personnel
Morgan Langille has started as a post doc on the project in the Eisen lab
B. Research
Eisen lab
Testing HMMER3
HMMER3 is a new version of HMMER that greatly improves from the previous well used version. A brief overview of this was given by Morgan Langille in a recent lab presentation.
Changes & Features
- Much faster (~100X) and is similar in speed to Blast.
- Alignments have confidence scores for each residue in the alignment; therefore, allowing easy masking of low confidence aligned regions.
- Scoring is done by sequence (taking into account all alignments), and not scoring only the top alignment which maybe incorrect. This should be useful for low similarity searches.
- phmmer and jackhmmer are Hmmer3 replacements for Blastp and PSI-BLAST.
- hmmpfam is now called hmmscan.
- hmmcalibrate is built into hmmbuild .
- hmmpress is used to convert hmms (created by hmmbuild) into binary files that allow faster hmmscan searching.
- new tab-delimited output formats (--tblout & -domtblout).
Comments & Warnings
- HMMER 3 is still in beta testing so there could be bugs and changes made in the future.
- It is not parallellized yet so jobs need to be split up and ran separately to take advantage of multi-core machines or large computer clusters.
- Old HMMER 2 profiles can be converted using the hmmconvert command, but really should be re-built using hmmbuild to take advantage of all changes in HMMER 3.
- HMMER 3 has no glocal option any more (only local). Therefore HMMER 3 may have difficulty with finding short hmms built with very divergent input seqeunces (i.e. zinc finger transcription factors). More details |here.
Community profiling
Morgan Langille has started as a post doc on the project, in essence replacing Sourav Chatterji. He has begun work on "community profiling".
Basically, this idea is similar to phylogenetic profiling where genes from an organism are searched for in other completed genomes and then their relative number or presence/absence is recorded for each gene in every other genome. This may lead to a group of genes having a similar profile and therefore having a common function. For example, in blah identified genes that were present in only spore forming bacteria, but were absent in nearly all other genomes. Most of these genes were annotated with function related to spore formation, while genes with no known function were hypothesized to be linked to spore formation.
Community profiling does the same thing but instead of looking at presence/absence or relative number across different organisms, relative number of gene families are identified over multiple metagenomic samples. It is currently not clear how well this methodology will work in practice, but if successful it could help identify possible functions for completely novel gene families.
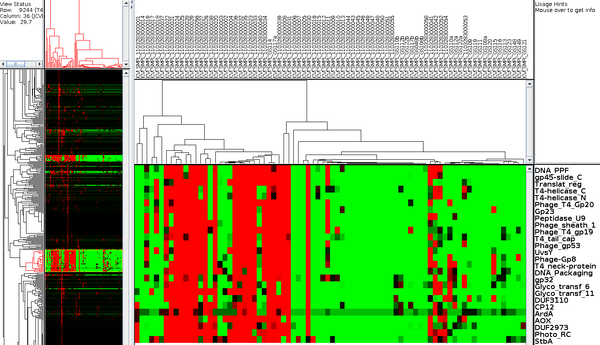
A first attempt at community profiling was done by identifying PFAMs (11,000 HMMs) in metagenomic sequences from GOS (41 million peptide sequences across 80 samples). Pfam predictions (12.5M) by HMMER 3 were grouped into their corresponding samples and enumerated. This data was then clustered using microarry clustering software, Cluster 3.0.
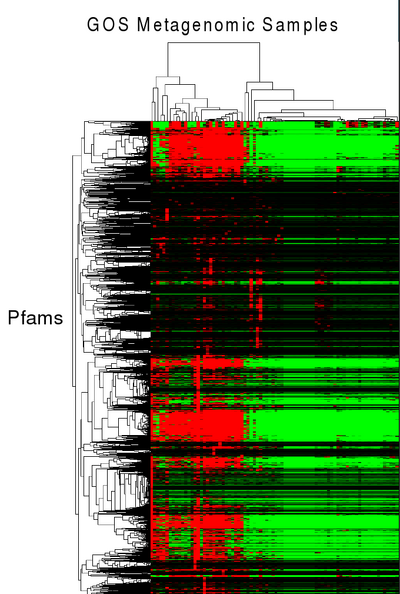
Pfams that have similar profiles (clustered together), may have similar function. For example in the figure below, a cluster of pfams all seem to be related to phage and using this data, domains of unknown Function (DUFs), DUF3110 and DUF2973 could be hypothesized to also be related to phage.
We are currently fine tuning (normalizing the data in various ways), and evaluating how well it works. Future research will expand the number of metagenomic samples beyond the GOS data, thereby giving more resolution to genes with similar profiles. Also, gene families besides Pfams will be tested.
Protein families
HMM profile building for families with high universality across bacterial kingdom
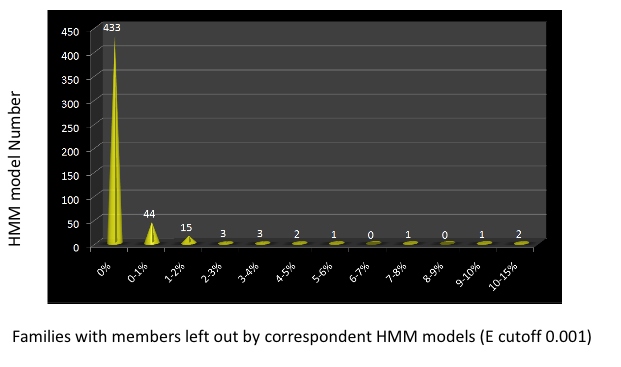
Proteins from 502 bacterial families with universality larger than 70 were retrieved. For each family, the peptides were blastp searched against each other and a similarity cutoff of 80 over 80% length span was applied to build MCL clusters. One representative from each MCL cluster was collected and served as the seed for HMM profile building. HMM profiles were built by HMMER2,and gene functions were assigned to all the profiles. The HMM models were searched against the corespondent gene families members and the genbank NRAA database to define trusted cutoffs and noise cutoffs. These HMM searches against the gene families demonstrated that the overwhelming majority of the HMM models we built represent the gene families well and can pick all the family members with the identified cutoffs. A few exceptions are illustrated in the following figure, which shows that a few proteins were included in the families but actually do not belong there and should be removed.
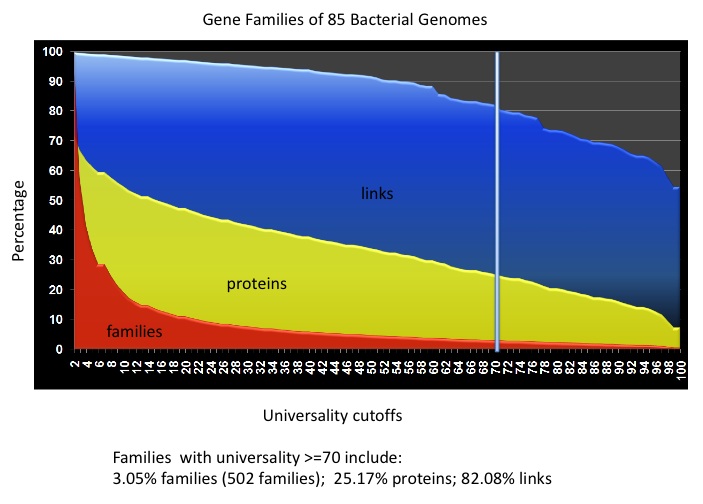
In the 502 HMM profiles, we can use the models for the 31 AMPHORA markers and the 25 new bacterial markers to identify phylogenetic marker genes from metagenomic data. We have also observed that many of the models are ready to pick up gene families with high copy number in almost all the bacterial genomes, which are one of the main hurdles to building gene families for metagenomic data. We examined the gene family building processes for the 85 bacterial representative genomes. We found that if we use the 502 HMM models to screen the whole proteome, we can cover 25% of the proteins, and - more importantly - more than 80% of the protein similarity links (See the following figure). For a metagenomic dataset, we can use the HMM models to pre-screen the protein data to build gene families, and make global gene family building feasible for the rest of the dataset.
The 502 HMM models can also serve as the starting point to identify more phylogenetic markers at different taxonomic levels. We are currently screening actinobacterial compelete genomes with the 502 HMM profiles to identify more potential phylogenomic markers at the phylum level.
CAMPHOR
As mentioned in the previous report, we have developed a new nucleotide-based pipeline named CAMPHOR (Complimentary AMPHORa). We are working on adding additional markers identified by Dongying Wu for enhancing the phylotyping prediction. Also, with anticipated release of HMMER3, the pipeline will be overhauled to replace the previous version of HMMER with an incredibly faster one for speedy and yet accurate results.
MOTHUR
We are also surveying the newly released open source pipeline, Mothur, for microbial ecology informatics. This survey is an in-depth look into the framework and developmental issues of an open source pipeline and will provide valuable information from their pluses and minuses for our pipeline. Also, it may facilitate learning of modularization of numerous parallel and in-sync pieces of software and tools.
Green lab
Metagenomic analysis of community phylogenetic structure
The use of metagenomic data to study patterns of phylogenetic diversity within and among communities of co-occurring microbes requires two steps: generation of a phylogeny linking metagenomic reads in environmental samples, and metrics of community phylogenetic structure and turnover.
Phylogenetic inference for metagenomic data
Since community phylogenetic stucture can only be studied once a phylogeny has been inferred, recent progress on this objective has focused on developing and evaluating different methods to infer phylogenetic relationships among metagenomic reads.
Using the HOT/ALOHA dataset hosted by CAMERA as an example data set, we identified metagenomic reads from 31 gene families using AMPHORA. To provide a sufficient number of reads to estimate phylogenetic diversity within each environmental sample in this data set, the metagenomic reads from all gene families (query sequences) were then combined with the 571 full-length sequences from AMPHORA (reference sequences) into a single concatenated/tiled alignment. Scripts to perform this concatenation/tiling are provided here. We have explored two methods for inferring phylogenetic relationships among metagenomic reads using this approach.
The first approach has been to perform a phylogenetic analysis on the entire combined alignment using maximum likelihood methods. This approach uses the phylogenetic signal in the reference sequences to help anchor the query sequences. The topology of the AMPHORA genome tree can be used as a constraint to speed up tree inference. The reference sequences are then pruned from the resulting tree, leaving a tree linking all query sequences. This approach works for data sets of moderate size such as the HOT/ALOHA data set but would not be computationally feasible for larger metagenomic data sets such as GOS due to the time consuming nature of the ML tree search and optimization. For large data sets such as GOS we are currently applying a similar method but using neighbor joining methods to infer phylogenetic relationships for individual gene families.
The second approach uses a recently developed algorithm for placement of individual reads onto a reference phylogeny using likelihood optimization of query sequence placement and branch lengths. This method is implemented in RAxML 7.2.1a and speeds up the placement of reads relative to the previously described methods since individual reads can be placed without optimizing their relationships with all other reads. The method also gives an indication of how much unceratinty there is in the placement of each query sequence. We are currently exploring this approach, preliminary results indicate that there is a great deal of uncertainty in the placement of reads on the reference phylogeny. We will evaluate the effects of this unceratinty on all measures of community phylogenetic structure (see below) by repeating analyses on multiple trees obtained by placing sequences on the reference phylogeny with probability weighted by the likelihood of the placement.
We plan to use the metagenomic simulator developed by the Pollard lab to evaluate the relative performance of all of these methods.
Community phylogenetic structure
Once we have identified the best-performing phylogenetic inference method, we will proceed with in-depth analyses of community phylogenetic structure and turnvover in several of the public data sets hosted by CAMERA. Progress is described in more details here.
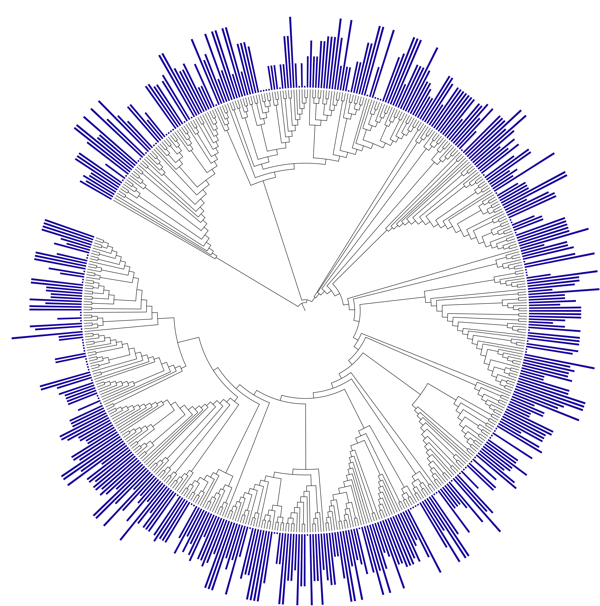
Initial analyses of community phylogenetic structure in the HOT/ALOHA data set based on the 31-gene family phylogeny mentioned above revealed that patterns of phylogenetic diversity and turnover are much stronger along environmental gradients in this data set than patterns of taxonomic diversity or turnover. For example, phylogenetic diversity within communities (average phylogenetic distance among sequences in an environmental sample) and phylogenetic turnover among communities (average phylogenetic distance among sequences in different environmental sample) varied with depth and number of other environmental variables. Environmental samples from shallower depths contained species that were phylogenetically clustered, and environmental samples close together in space and from environmentally similar locations tended to contain closely related species.
Novel Biodiversity Measures
As a basis for developing new theoretical measures and predictions for phylogenetic diversity, we have derived a spatially-explicit model for predicting taxonomic diversity. Our approach is to model a community from the bottom-up, specifying some mechanistic rules for the behavior of individuals, and then seeing what macroscopic patterns emerge. This has the advantage that we make very few assumptions about large-scale community assembly, instead building up a community from the combination of stochastic birth, death, speciation and dispersal of individuals across a continuous spatial landscape. We have focused on deriving predictions for the Species- or Taxa-Area Relationship (SAR), which characterizes the increase in the observed number of species with increasing sample area. Given that we are considering related patterns from different perspectives, this project naturally has a lot of synergy with the Pollard lab, and one of the exciting outcomes will be to piece together the results we are obtaining.
Stochastic spatially-explicit community assembly has been a long-standing problem in theoretical ecology, and our model draws heavily from the toolbox of quantum and statistical field theory to solve it. The central equations we derive are functional differential equations for a partition function---a mathematical object which summarizes all observable spatial patterns for our community, and from this formidable set of equations we have pulled out the functional form of the SAR.
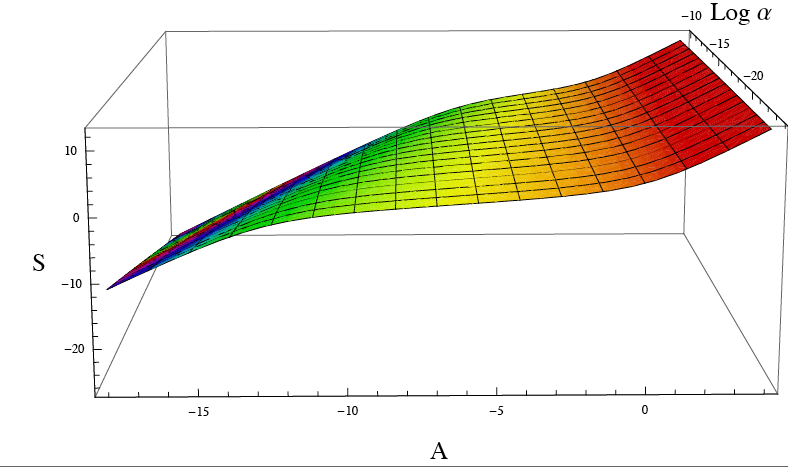
The result is an SAR with three distinct phases, and at intermediate scales our SAR is closely approximated by a power law, so that on log-log axes a plot of species number as a function of area is linear, with a slope determined by the underlying evolutionary processes. This power law shape is one of the classic SAR patterns, and our model provides the first analytical prediction for this law using a stochastic spatially-explicit model. In the figure below, we have plotted the logarithm of species number as a function of log area, for various different values of the speciation rate in our model, which we've called alpha.
As the speciation rate alpha changes, the boundaries of the three phases shift, as does the slope of the power law, which we can express directly in terms of speciation rate. This has important consequences for microbial ecology, where speciation rates are expected to be radically different than those for larger species, and we are now working to test our model against microbial metagenomic data.
Pollard Lab
Species Area Relationships
A fundamental question in microbial community ecology is how taxonomic richness scales with area. Answering this question has implications for understanding microbial evolution – whether microbes are primarily adapted to specific niches or cosmopolitan – and estimating regional to global microbial diversity. However, addressing this question is complicated by the fact that it is difficult to census microbes in large regions. For instance, it is impractical to census all microbes inhabiting large volumes of sea water.
To overcome this difficulty, a promising approach is to infer richness-area scaling from distance-decay relationships. A distance-decay relationship describes how the similarity of communities decays as a function of the spatial distance between them. To construct a distance decay relationship, the taxa in numerous small, equally sized plots are censused. For various subsets of the plots, a measure of similarity is then calculated -- for instance, the number of taxa that the plots share divided by the total number of species in the plots -- and this is regressed on the distance between the plots. Distance-decay relationships can easily be constructed from metagenomic data sets (e.g., GOS) by treating each sampling location as a plot.
Although distance-decay relationships can easily be constructed, it is challenging to infer richness-area scaling from them. Indeed, how to accurately make such inferences remains an open question in ecology. Our work has aimed to address this question. We propose a method that estimates rates at which richness changes with area. Integrating these rates yields richness estimates at different areas. Very briefly, we infer the rates by extrapolating the similarity at short distances (i.e., when plots are adjacent) from empirical distance-decay relationships.
In order to extrapolate to short distances, which are generally outside of the range of the data, it is necessary to assume a functional form of the distance-decay relationship. Initially, we assumed a logistic model, which states that the logit of the Sorenson Index (a measure of similarity) decays linearly with the log of the distance. Logistic models are used widely in statistics, and we found that this model was generally a good fit to many empirical distance-decay relationships. However, within the last few months we have found that this model can lead to biased richness estimates when it is necessary to extrapolate substantially beyond the range of the observations, as is the case with metagenomic data. Moreover, it is unclear why this model is appropriate for distance-decay relationships: to our knowledge, there is no a priori reason to expect that the distance-decay relationship should be logistic.
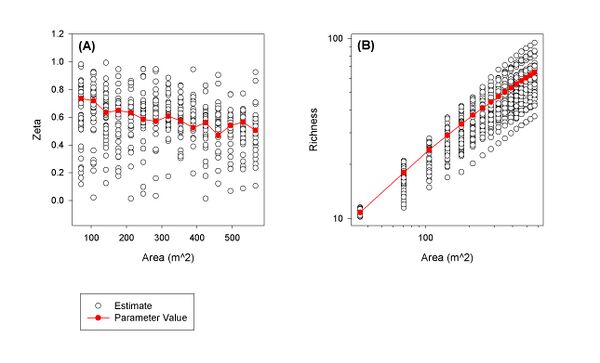
To overcome these two shortcomings, we have developed a second model, a quadratic rational model. This model can be derived from generally reasonable assumptions about the spatial distribution of species. Moreover, preliminary results suggest that this model performs well when extrapolating beyond the range of the observations. An example of the performance of this model is given in Figure 1. Currently, we are continuing to validate this model, refining the arguments necessary to derive it, and applying it to metagenomic data. We anticipate publishing our results shortly.
A Metagenomic Simulator
Phylogenetic analyses of metagenomic data form the central or preliminary step for several different parts of the iSEEM project. One of our immediate goals is to build phylogenetic trees for several gene families using the metagenomic reads that contain matches to each gene family. We do this as follows: For a given gene family, e.g., rpoB, we first identify the metagenomic reads containing a subsequence that may belong to the rpoB family. Then we build a multiple sequence alignment of these reads; we typically also include in this multiple sequence alignment full-length known rpoB sequences from species with fully sequenced genomes. Finally, we build a phylogenetic tree from the multiple sequence alignment. We intentionally avoid assembling reads in order to limit the accumulation of errors in the sequences.
There are several challenges inherent in this process. The metagenomic reads are short enough that many may not overlap at all in the alignment. Traditional phylogenetic methods are not designed for this type of data, and it is unclear how they will perform on it. After discussing this problem with as many people doing related research as we could (there is a wiki page with details on these discussions), we came to the conclusion that there is not a strong consensus on how to solve this problem. Another challenge is that the set of metagenomic reads in the alignment may be quite large. Hence, methods that tend to be more robust against gaps in the alignment, such as full Maximum Likelihood, may be too slow to perform well on real data sets.
In order to test the accuracy, robustness, capacity, and relative performance of several phylogenetic methods, we have built a pipeline for simulating the type of metagenomic data that we plan to analyze. Beyond testing phylogenetic methods, the simulated data sets may also be useful for other parts of the iSEEM project, including in the analysis of methods for estimating phylogenetic diversity. We expect to make samples of simulated metagenomic data sets available soon on the wiki.
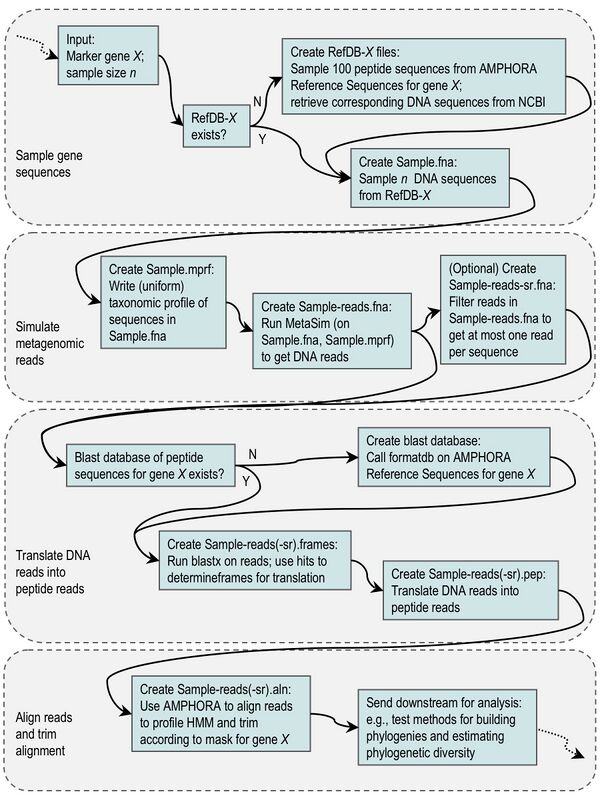
The metagenomic simulation pipeline we designed is made up of many data processing steps and uses several freely available software programs. These analysis units are linked together by custom Perl scripts. At a very high level, the simulation pipeline samples full-length sequences for a given gene family from the AMPHORA database, uses the MetaSim program to fragment these sequences into simulated metagenomic reads, translates the reads into peptides, and outputs an alignment of the peptide reads. The flow chart below gives some details about the steps in the pipeline. More information and updates about the simulator are available on the wiki at Samantha Riesenfeld's user page and the simulations project page.
C. Communications, Collaboration, Outreach and Education
Publications supported by this grant
- A phylogeny-driven genomic encyclopedia of Bacteria and Archaea. Dongying Wu et al. Submitted.
- This paper describes the sequencing and analysis of 50+ genomes selected by their phylogenetic novelty. Much of the analysis of gene families and the genomic data in this paper was supported by the iSEEM grant as these new genomes are directly useful to our gene family analyses.
Talks
- Katie Pollard spoke about methods for detecting non-neutral rates of DNA substitutions from genomic sequences at the Society for Molecular Biology and Evolution meeting in Iowa City (June 2009) and the Symposium on Evolution at the California Academy of Sciences (April 2009).
- Jessica Green spoke about Theory and Metagenomics-based Biogeography at the ASM 109th General Meeting in Philadelphia, at the special interest session Genomics Enabled Biogeography of Planet Earth organized by Tiedje and Klugman (May 2009).
- Jonathan Eisen included a brief discussion of results from this project in multiple talks presented at the ASM General Meeting in May 2009.
Outreach
- Katie Pollard gave two lectures about evolution at the National Student Leadership Conference (for high school students), held in San Francisco (June 2009).
Working Groups
- Joshua Ladau is co-organizing a working group (with Edward F. Connor, San Francisco State University) at the National Institute for Mathematical and Biological Synthesis in Knoxville, Tennessee. The working group is developing improved methods of inference in ecology, and had its first meeting in May 2009. Steven Kembel and Katie Pollard are collaborators in the working group.
II. Group meetings
Notes from Weekly meetings will be included as PDFs in the report
- Notes 3_4_09
- Planning 3_6_09
- Notes 3_18_09
- Notes 3_25_09
- Notes 4_1_09
- Notes 4_8_09
- Notes 4_15_09
- Notes 4_22_09
- Notes 4_29_09
- Notes 5_13_09
- Notes 5_27_09
- Notes 6_03_09
- Notes 6_10_09
- Notes 6_17_09
- Notes 6_22_09
- Notes 6_24_09
III. Any unexpected challenges that imperil successful completion of the Outcome
CAMERA interactions
After many struggles we finally have gotten some response from CAMERA offering to get us access to some of their compute resources. Email thread is pasted here:
Hi Jonathan, Am writing to follow-up on the access requests from the thread below:
.
. (1) For shell level access to the compute resources - Adam Brust (abrust@soe.ucsd.edu - cc'd on this email) can assist with the accounts. Are there any specific requirements (e.g. software, memory, etc.) needed for your processing? As part of this work, if you are developing services that would be provided through CAMERA, you would then interface with Abel Lin and the applications team.
(2) In regards to the database, we have a development database where we could provide read access. Jing Chen (jic002@ucsd.edu), who is cc'd on the email, can assist with this access.
(3) We are in the final stages of getting the portal/workflow system deployed in the public environment. Once we have deployed in this environment - we will be able to provide access to the system.
In regards to (1) and (2) above, it would perhaps be beneficial to have a teleconference where we can get the appropriate CAMERA developers together with your group to outline any requirements for access to compute and data resources that we should be aware off.
Cheers, Jeff
Jonathan Eisen wrote:
Jeffrey S. Grethe wrote:
Hi Jonathan,
In regards to your question regarding accounts:
(1) For the compute resources, is this for shell level access (to run your own analyses) or related to the workflows and similar interface driven analyses?
both - we would benefit enormously from being able to run our own analyses in order to test and develop the methods and workflows that we are eventually supposed to deliver to CAMERA
(2) As part of the CAMERA 2.0 system there is a DB query/browser interface. Is this what you were looking to gain access to or were you looking to gain access to the database itself to run queries?
running queries --- this is the best thing in terms of designing our tools and in our computational needs
(3) I have added Abel Lin to the email thread who is leading the portal development. The team is currently setting up some of the new environments for the 2.0 release and I will check with him as to availability.
Cheers, Jeff
Paul Gilna wrote:
From: Jonathan Eisen <jaeisen@ucdavis.edu> Date: Mon, 1 Jun 2009 10:31:57 -0700 To: Paul Gilna <pgilna@soe.ucsd.edu> Subject: CAMERA account reminders
Paul
Just a little reminder. We really could use accounts at CMAERA to be able to (1) use the compute resources if possible and (2) get access to SQL queries and (3) play around with the Kepler workflows and related things from our tools
And other things I am sure
Is this going to be possible?
J

