BioMicroCenter:RIN
| HOME -- | SEQUENCING -- | LIBRARY PREP -- | HIGH-THROUGHPUT -- | COMPUTING -- | DATA MANAGEMENT -- | OTHER TECHNOLOGY |
RNA Integrity Number Guide
- Overview of Agilent software:
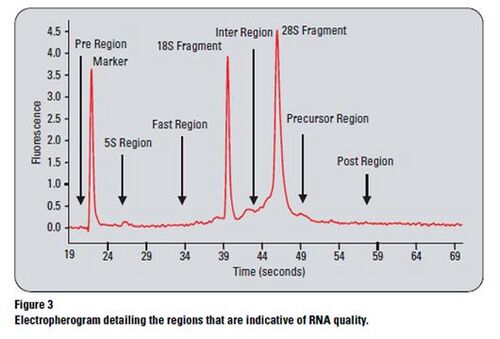
The software on the Agilent BioAnalyzer 2100 automatically calculates an RNA integrity number to an eukaryote total RNA sample. The sample integrity is no longer determined by the ratio of the ribosomal bands, but by the entire electrophoretic trace of the RNA sample. RINs are calculated whether there is a presence or absence of degradation of a given sample. RIN is independent of sample concentration, however is based on characteristics of several regions of the electropherogram (signal areas, intensities, ratios).
Degradation
- During degradation, the 28S band disappears faster than the 18s band, so with this, we can spot the beginning stages of degradation.
- The fast region: unexpected signal in fast region refers to how fact the degradation in the samples proceeded.
- Decrease in signal intensities for the ribosomal bands (28, 18s).
- Increase in smaller/ shorter fragments.
- Elevated baseline between the ribosomal peaks and also the lower marker.
RIN Upsets and Categories
If the software fines an unexpected peak or signal in certain critical regions, it will assign a RIN to a particular sample that has these anomalies.
- Critical regions: 5S region, fast region> not computed
- Non-critical: pre-regions, precursor-regions, post-region> RIN computed but will be low
- RIN can still be computed by increasing anomaly threshold settings (Set Pint Explorer)on the specific parameters reported on the errors page.
- Anomalies: Genomic DNA contamination, ghost peaks, spikes, wavy baselines
- The figure on the left shows typical representatives of the ten integrity categories that are based on the degradation of the sample.
Example nanoRNA Samples with RIN Numbers
RIN - an RNA integrity number for assigning integrity values to RNA measurements (Agilent)


